Continuous profiling for every DataDog runtime - Java, Go, Python, Node, .NET, PHP, Ruby, Native.
Ingest, flame graphs, library categorization, endpoint breakdown, cross-env comparison, and trace
pivot. Shipped behind profiles.preview=true.
0
DataDog runtimes supported
0
JFL services fingerprinted
0+
Unit tests landed
0ms
Flame p95 on 50k samples
Why
JFL was a DataDog-only profiling shop.
Their fleet: 571 services across 20 environments,
mostly Java/Spring, with .NET, Node, PHP, Python in the long tail. DataDog Java agent
versions span 1.31.2 through 1.60.3+, all comfortably
above the 1.30 floor needed for endpoint binding.
The Ask
Show JFL developers profile data alongside traces in the cluster they already trust -
same UX guarantees they had on DataDog, without asking them to swap agents.
The Constraint
DataDog-agent-only ingest for Phase 1. No custom agent, no symbolization, no OTLP/Profiles
yet. Match DataDog's developer workflow (flame, compare, endpoint, multi-runtime)
with the 80% that ships clean.
The Shape
Preview behind a flag. API path stable from day one. Warning: 299
header during preview, drops at GA. No URL churn for integrators when GA lands.
How
The ingest flow.
Two upload topologies, both validated end-to-end. JFL runs Pattern B in production,
the DataDog agent sits between the JVM and CubeAPM and re-uploads. Same multipart
wire format reaches the receiver either way.
Pattern A · Library-direct
JVM / Go / etc.dd-trace-{lang}
→
CubeAPM:3130/profiling/v1/input
Pattern B · Agent-forwarded (JFL's shape)
App poddd-trace-{lang}
→
DataDog AgentDaemonSet :8126
→
CubeAPM:3130/profiling/v1/input
Features
What ships in Phase 1.
Every UI surface JFL developers reach for first - picker, facets, flame, compare, endpoint
drill - done at production scale.
Service typeahead pickerFaceted filter railMulti-runtime ingestJFR fan-out per Java uploadLibrary categorizationOnly My Code view3 color modes3 group-by modesTop-50 + SandwichEndpoint breakdownMethod facetCompare-To with cross-env discoveryTrace pivotSelf-dogfood mode429 rate-limit on ingestMulti-tenant auth
01 · Overview
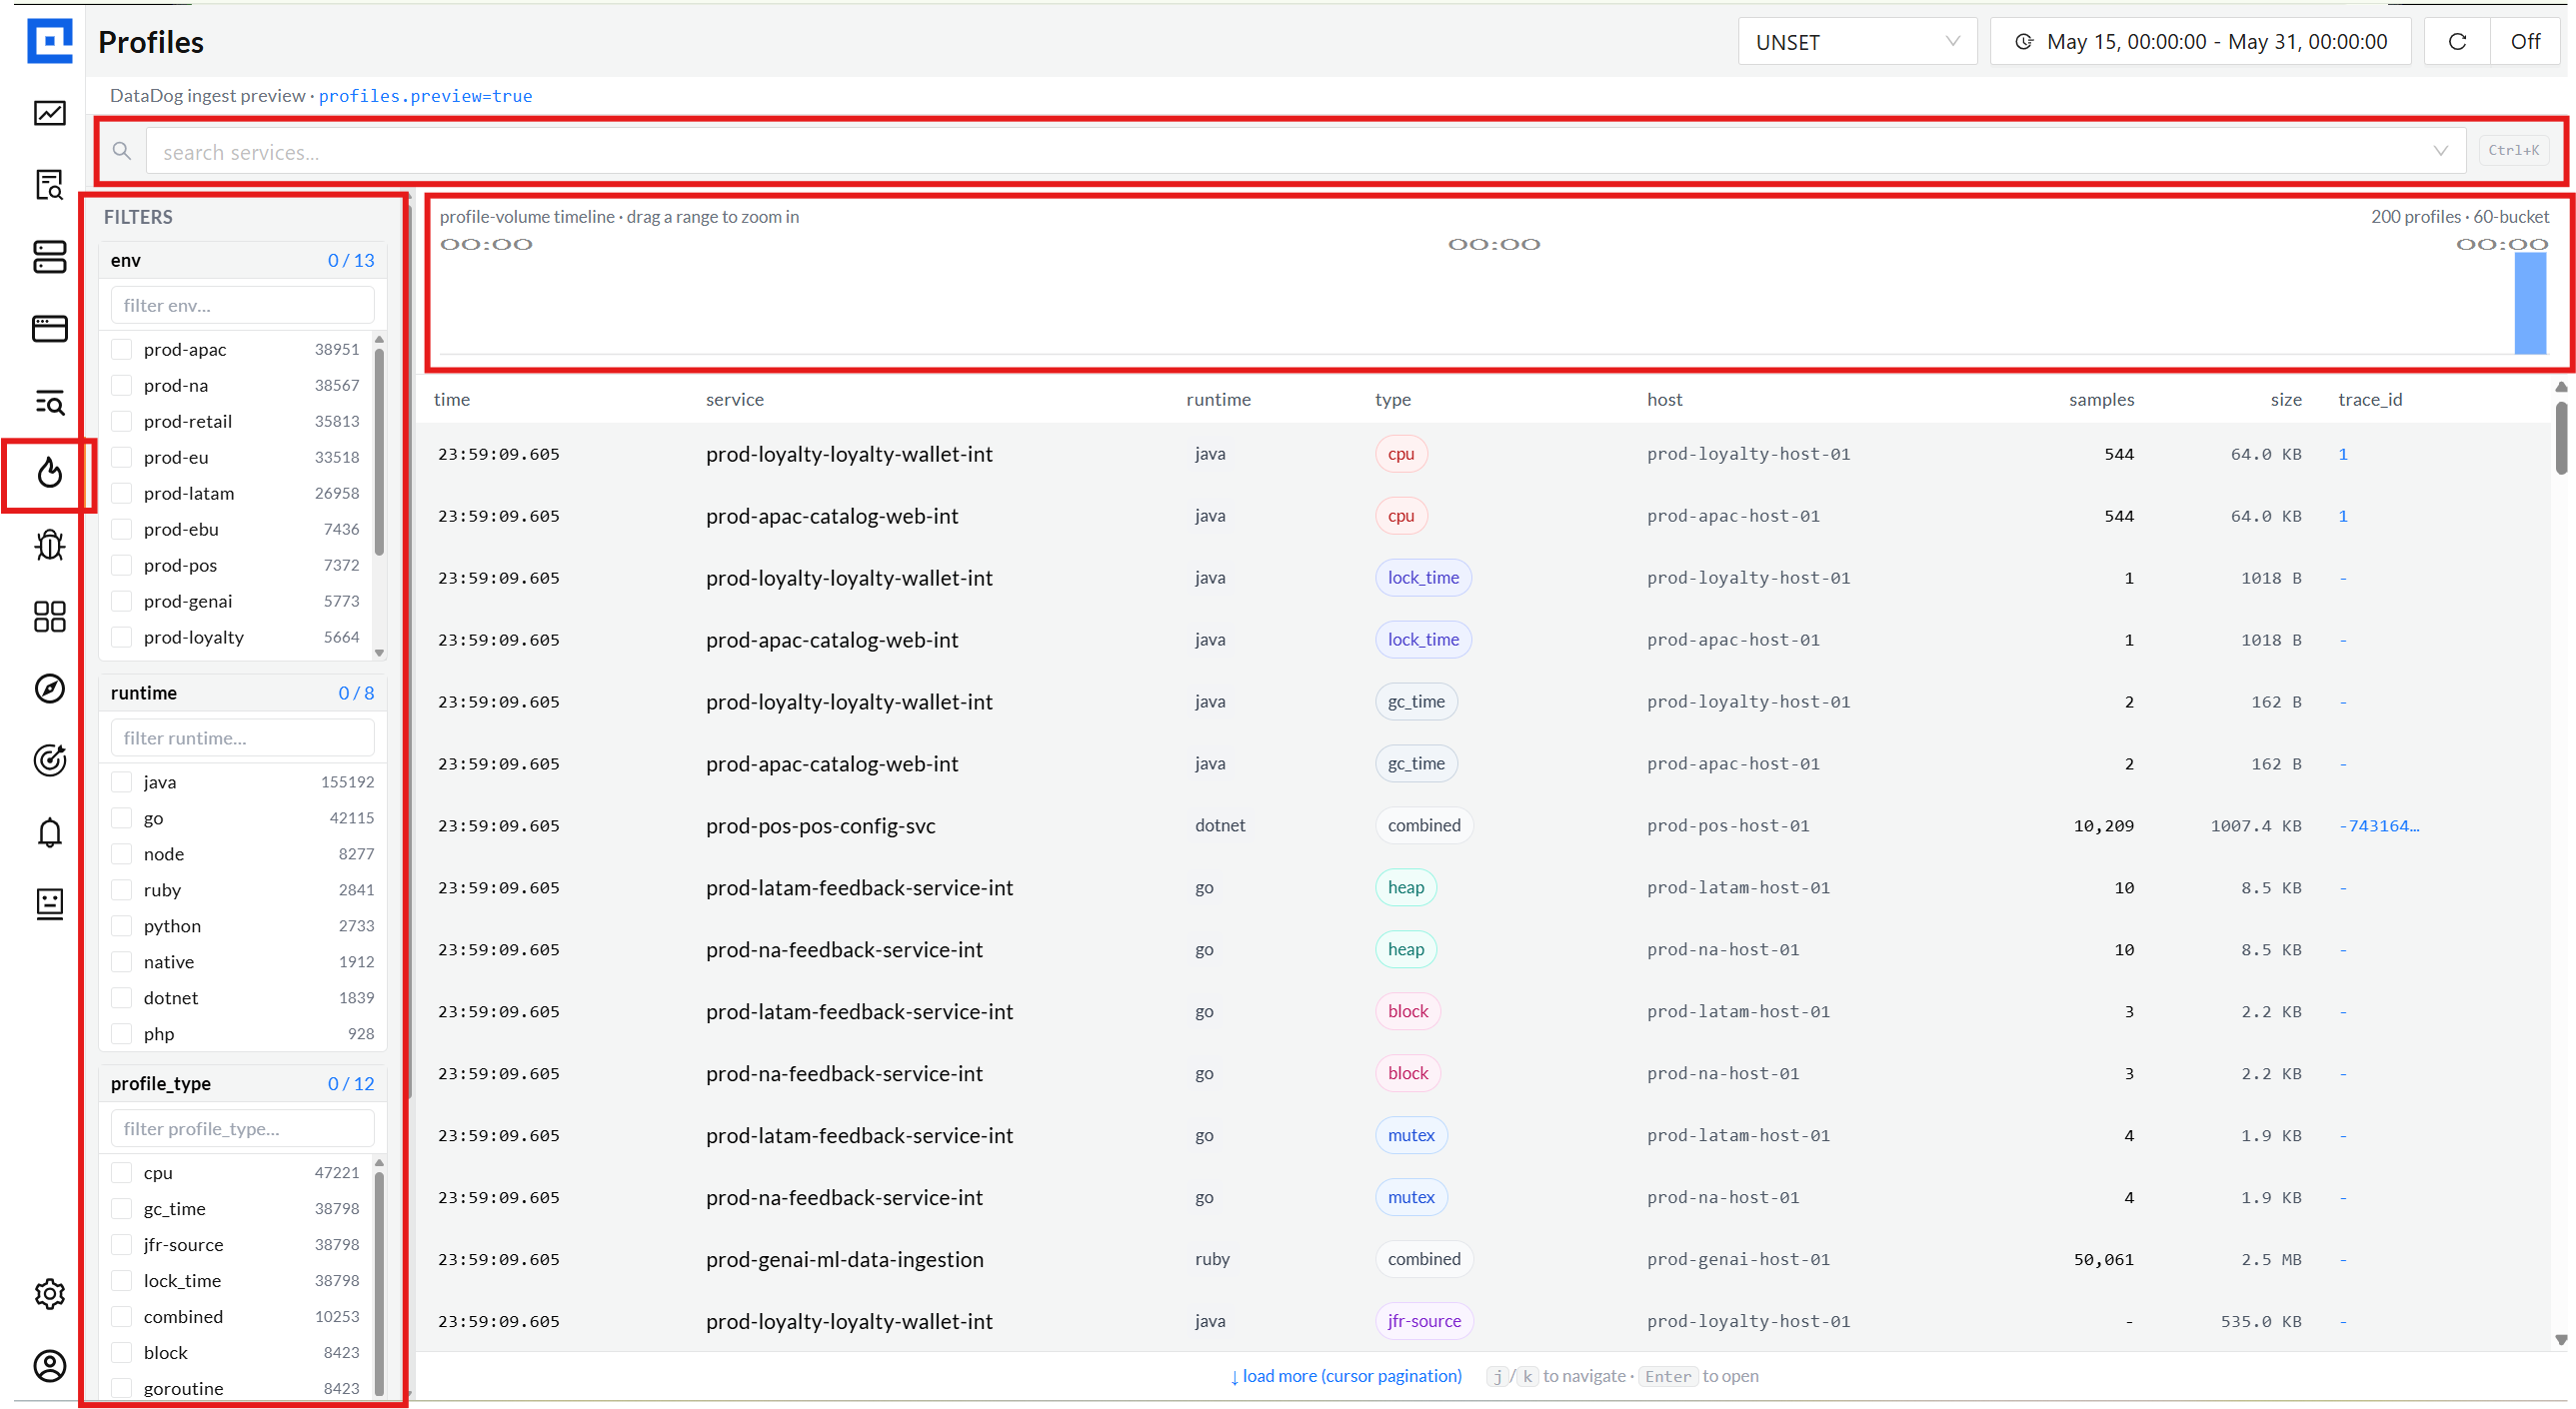
One page for the entire fleet.
The Profiles list pulls every recent capture across all services + envs, with a time
histogram across the top and faceted filtering on the left. The amber bar in the header
is the honest preview signal:
DataDog ingest preview · profiles.preview=true.
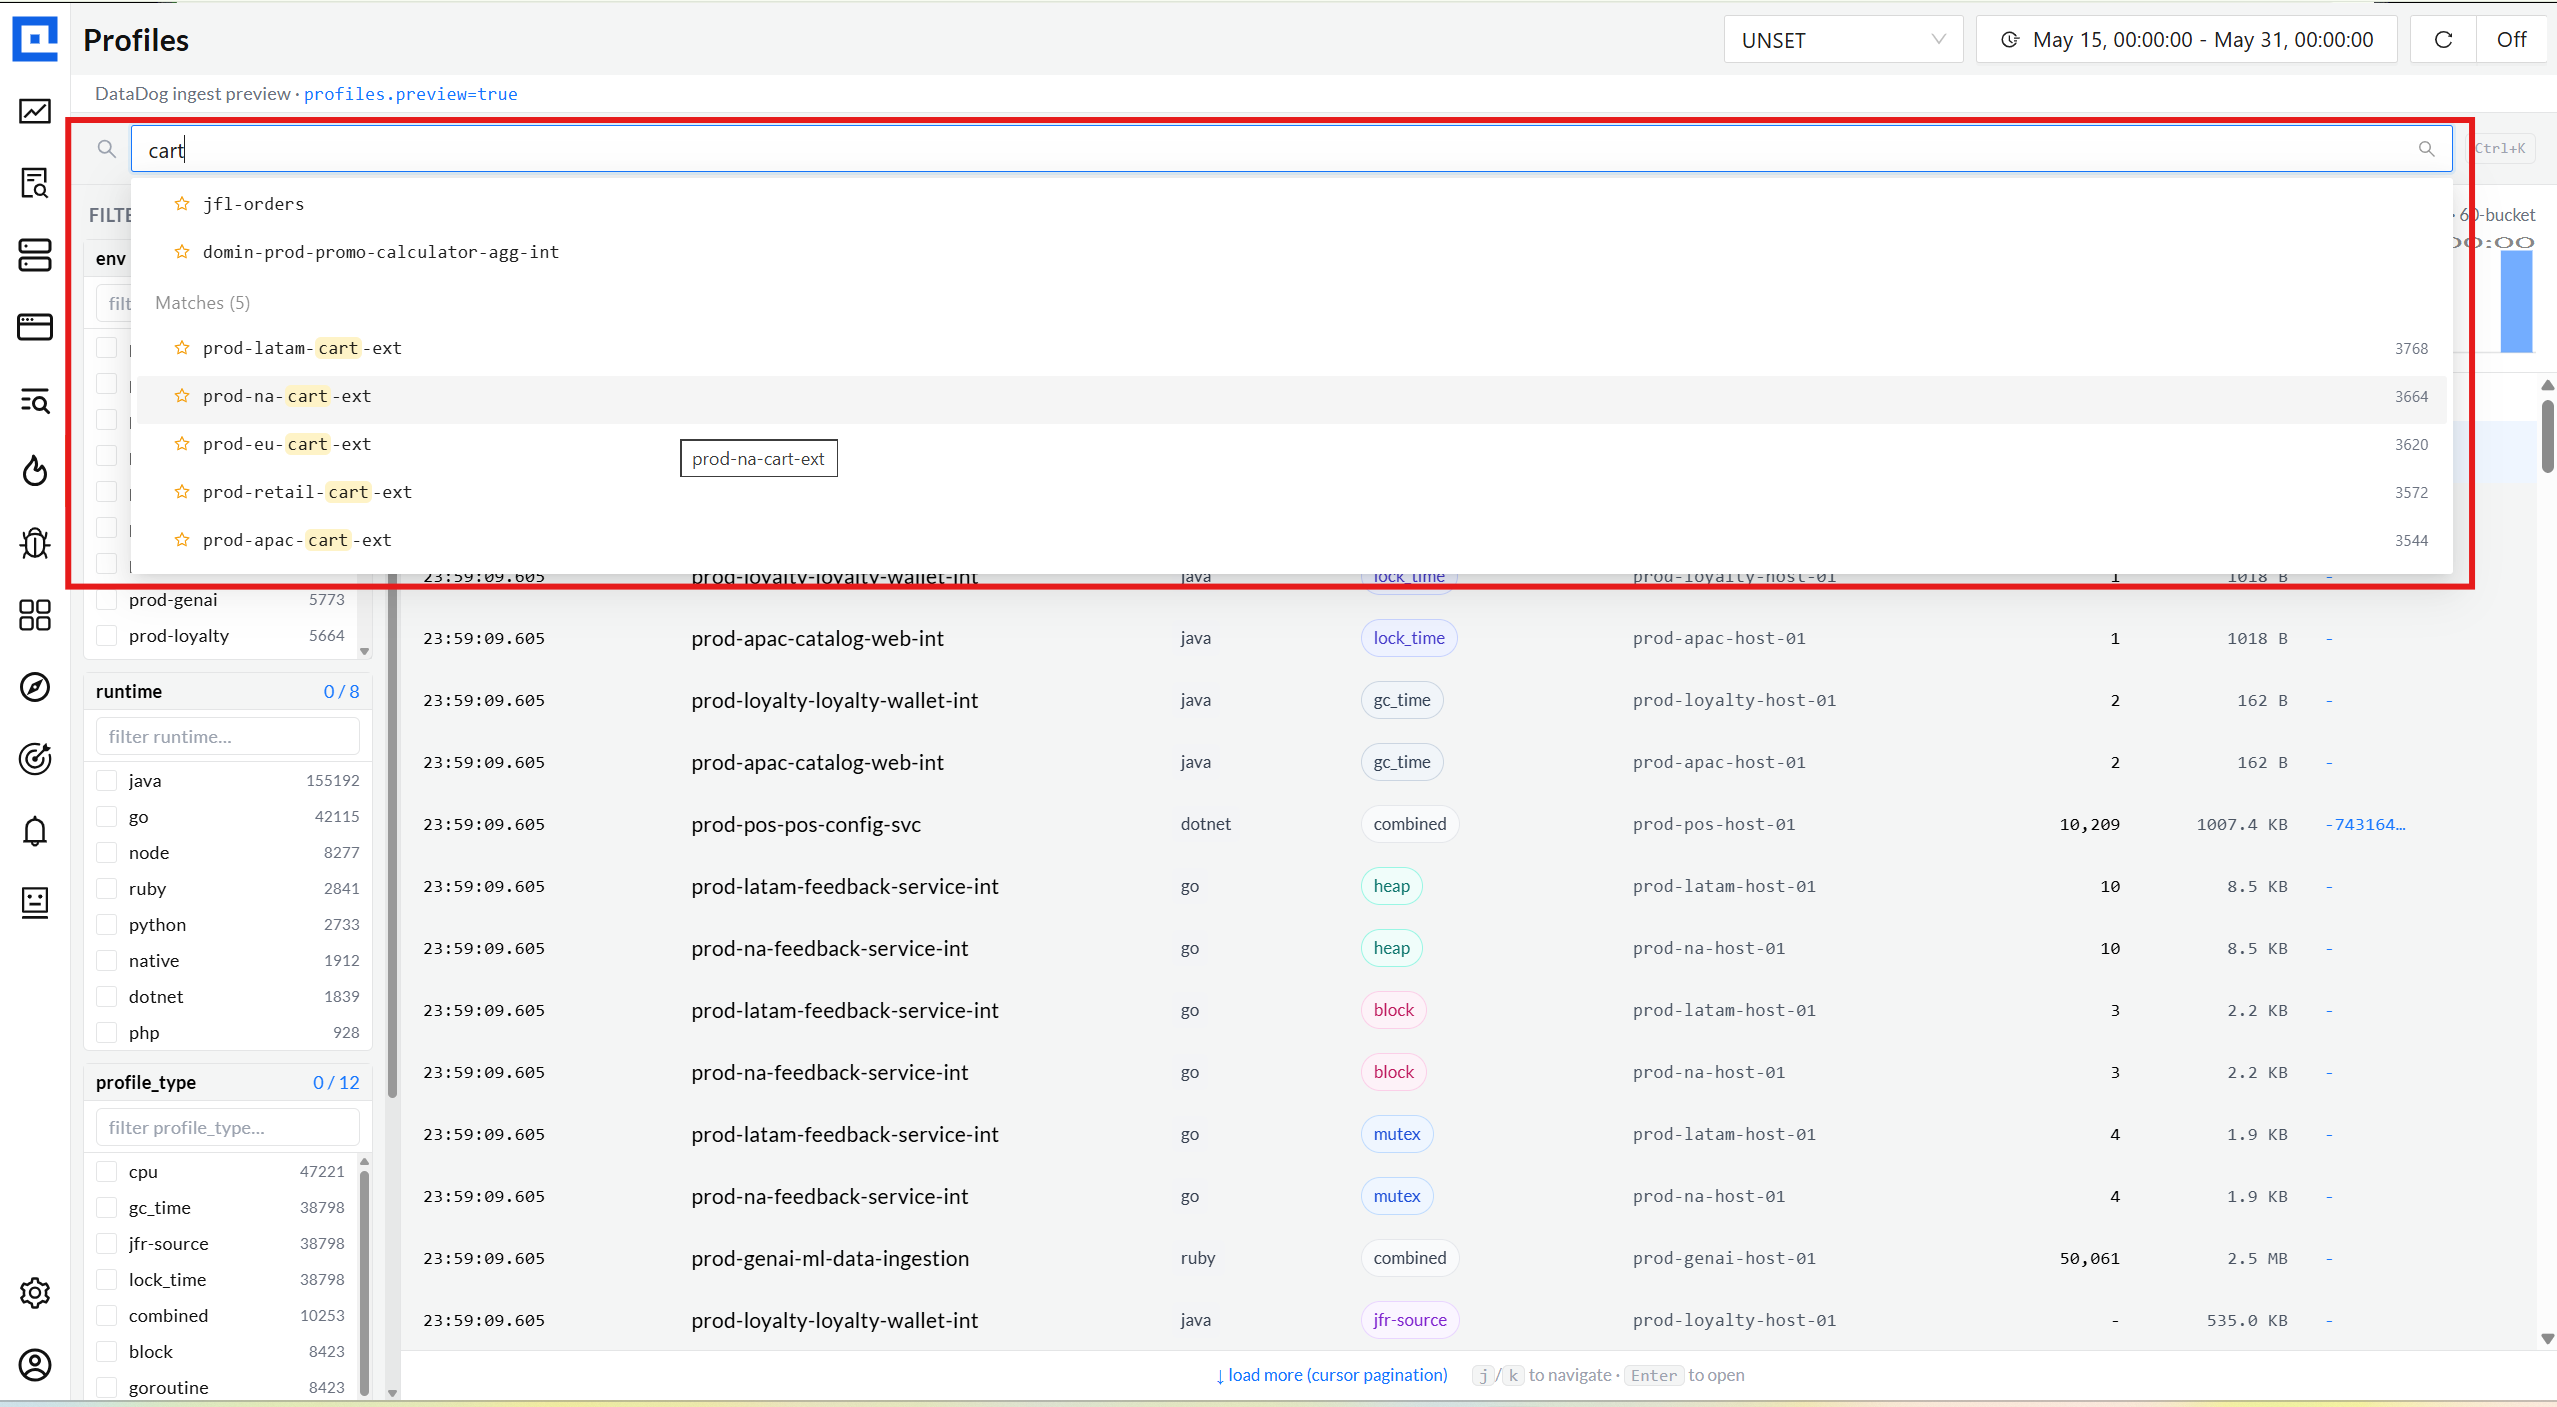
02 · Service picker
Type-ahead substring search beats a 571-row checkbox list.
DataDog's affordance, faithful. Substring match, virtualized dropdown, Pinned + Recent
sections, Cmd-K shortcut. Cross-env families surface together so devs spot the same
feature across regions in one keystroke.
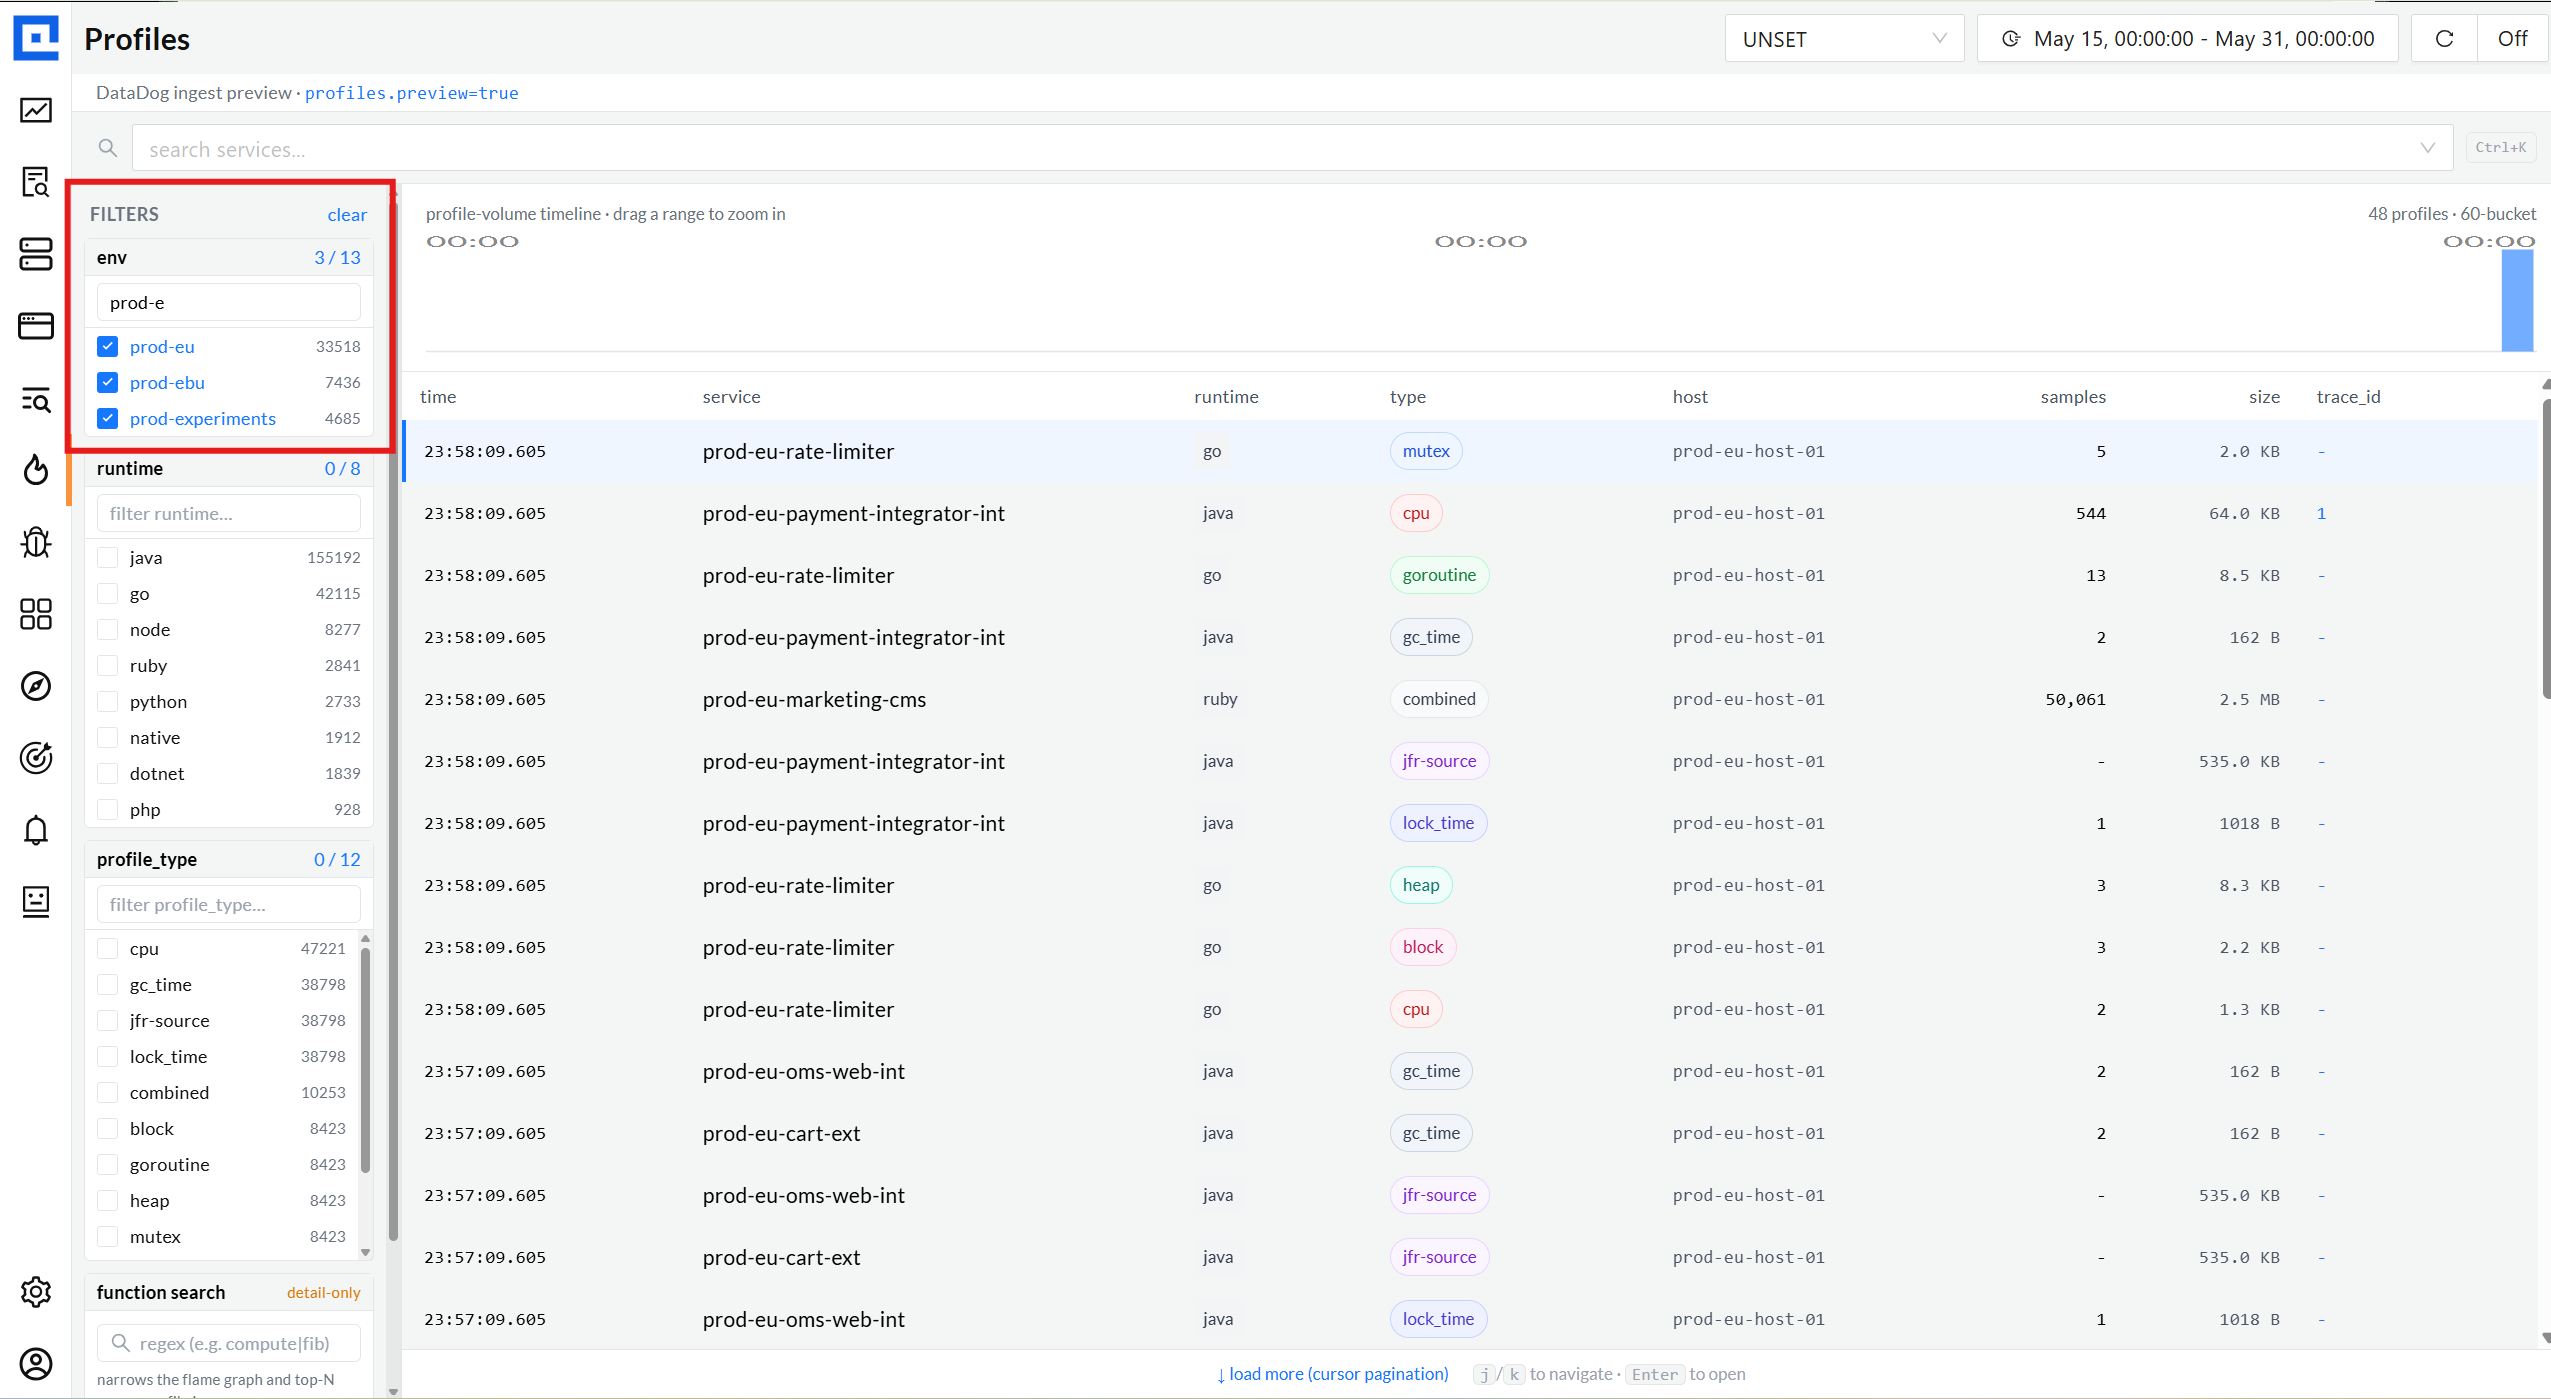
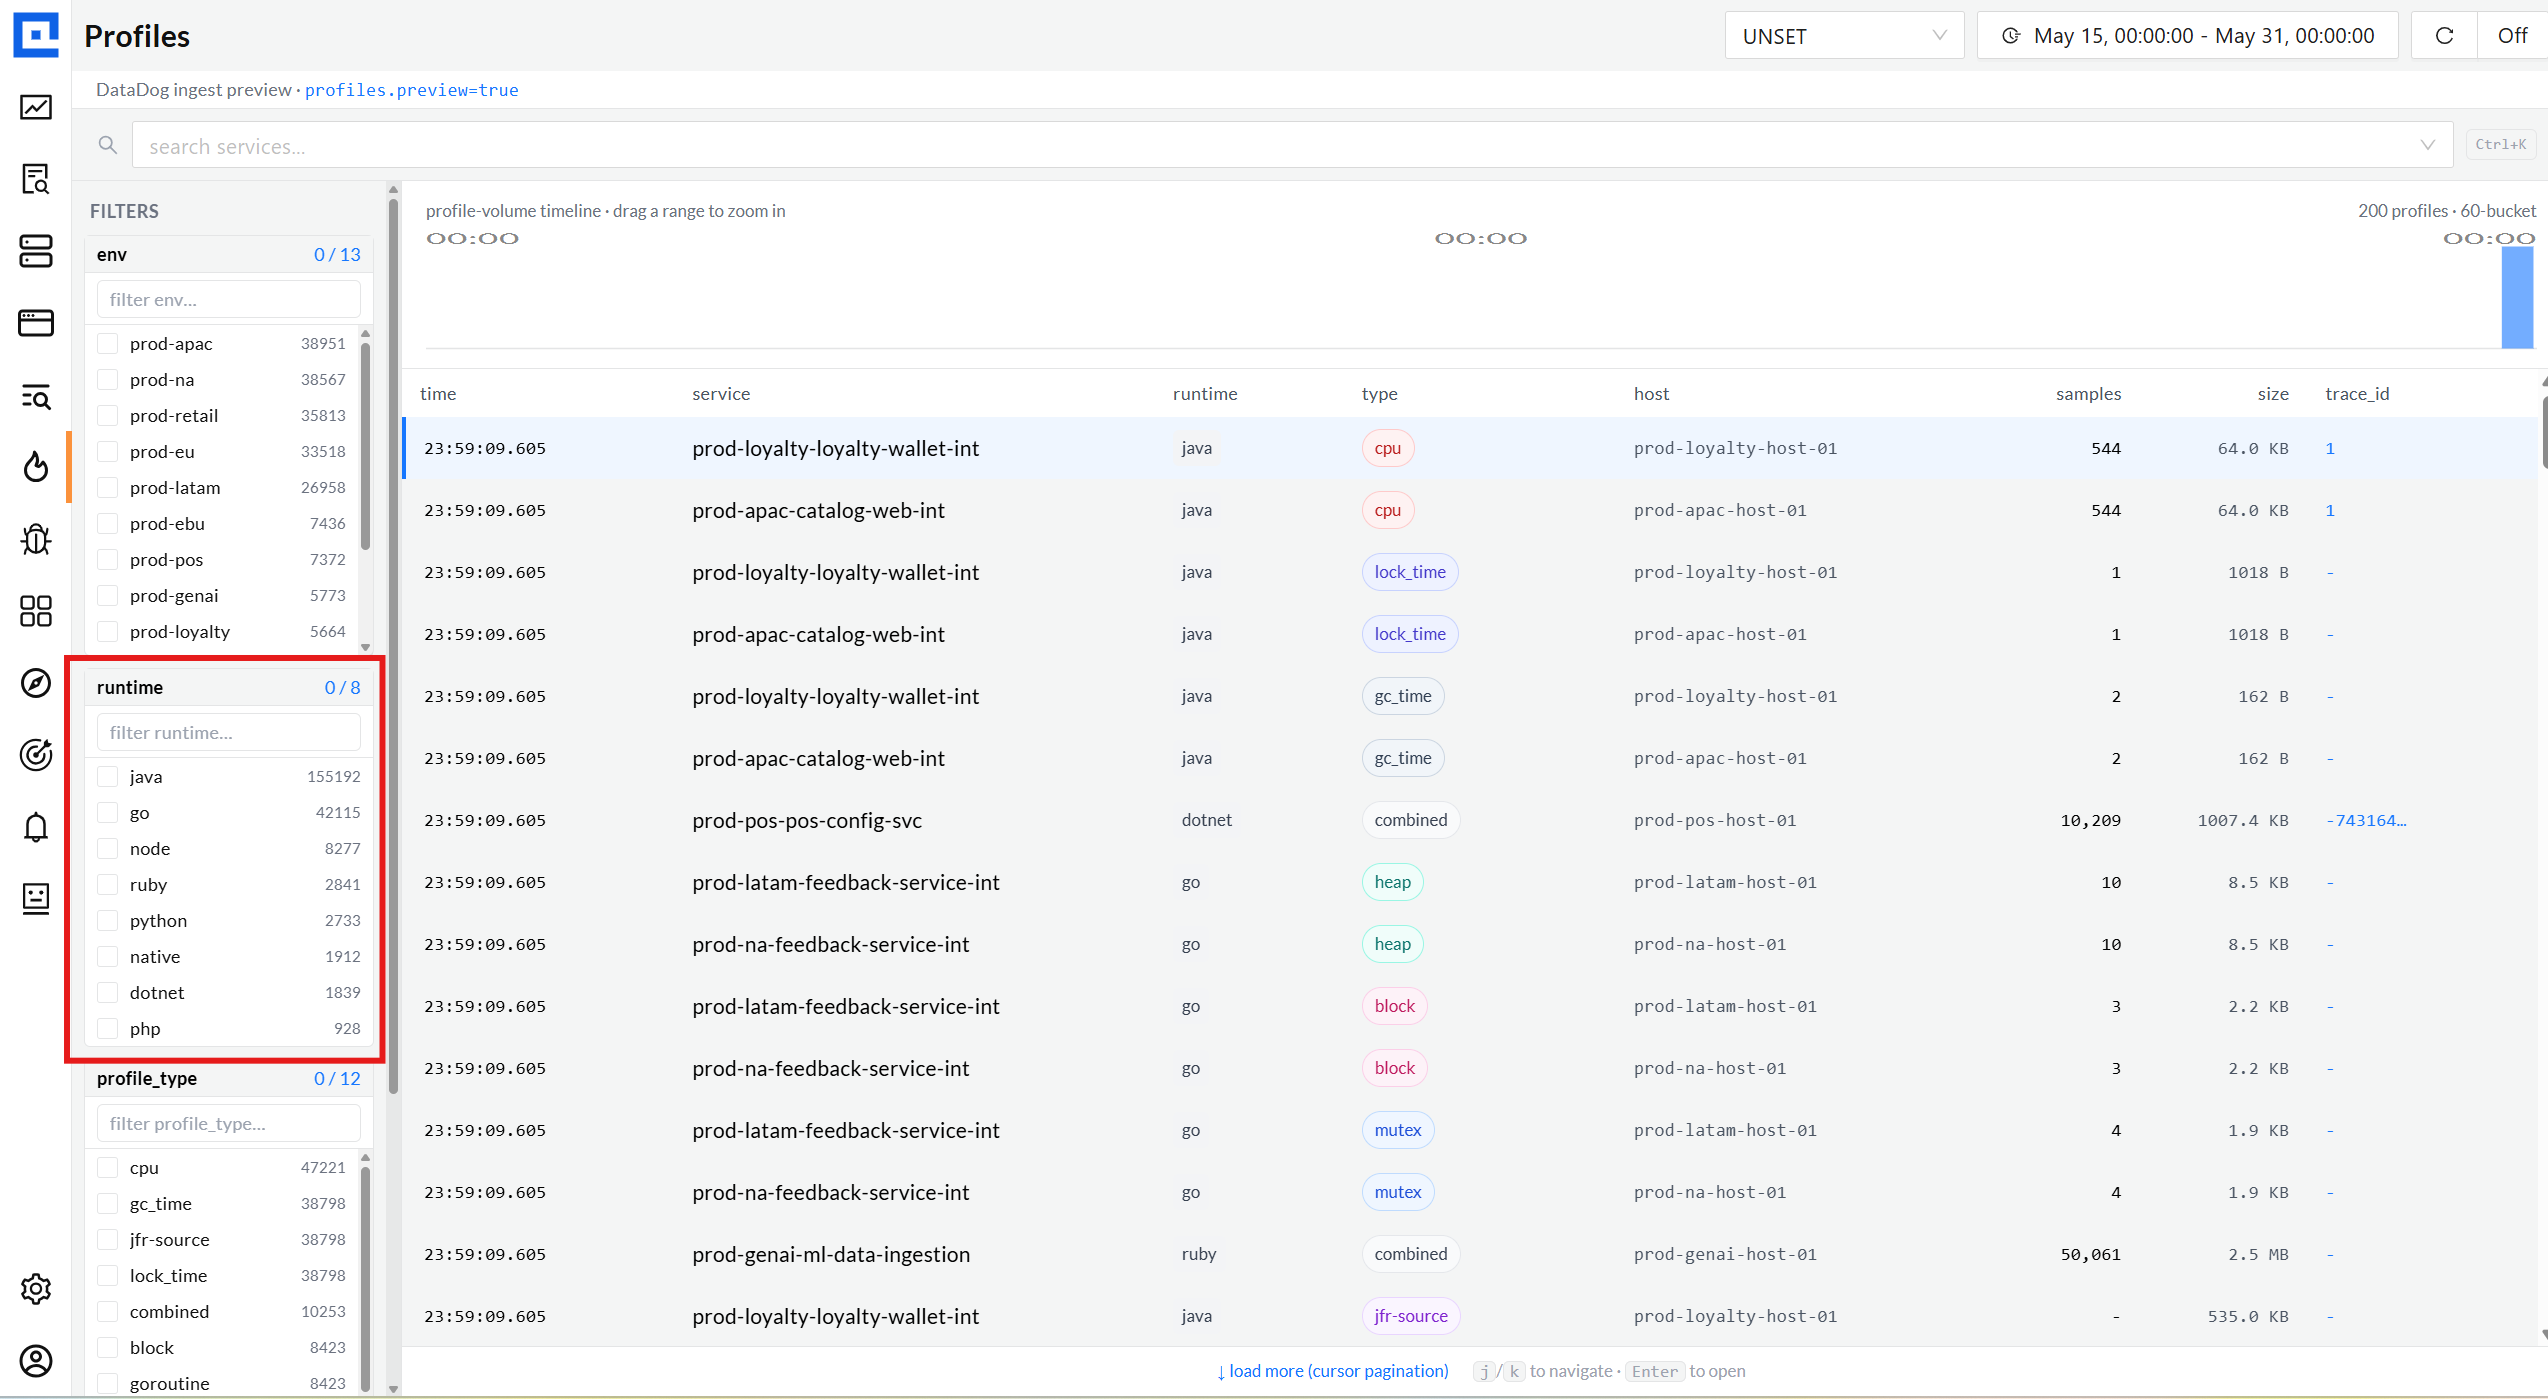
03 · Facets
Env, runtime, profile type - multi-select, with live counts.
Every facet is sourced from the actual ingest data via a single /field_values
endpoint. No hard-coded enums - when a new runtime appears tomorrow, the rail picks
it up automatically. Counts update live as the time picker shifts.
env facet · 14 environmentslive
runtime facet · 8 runtimeslive
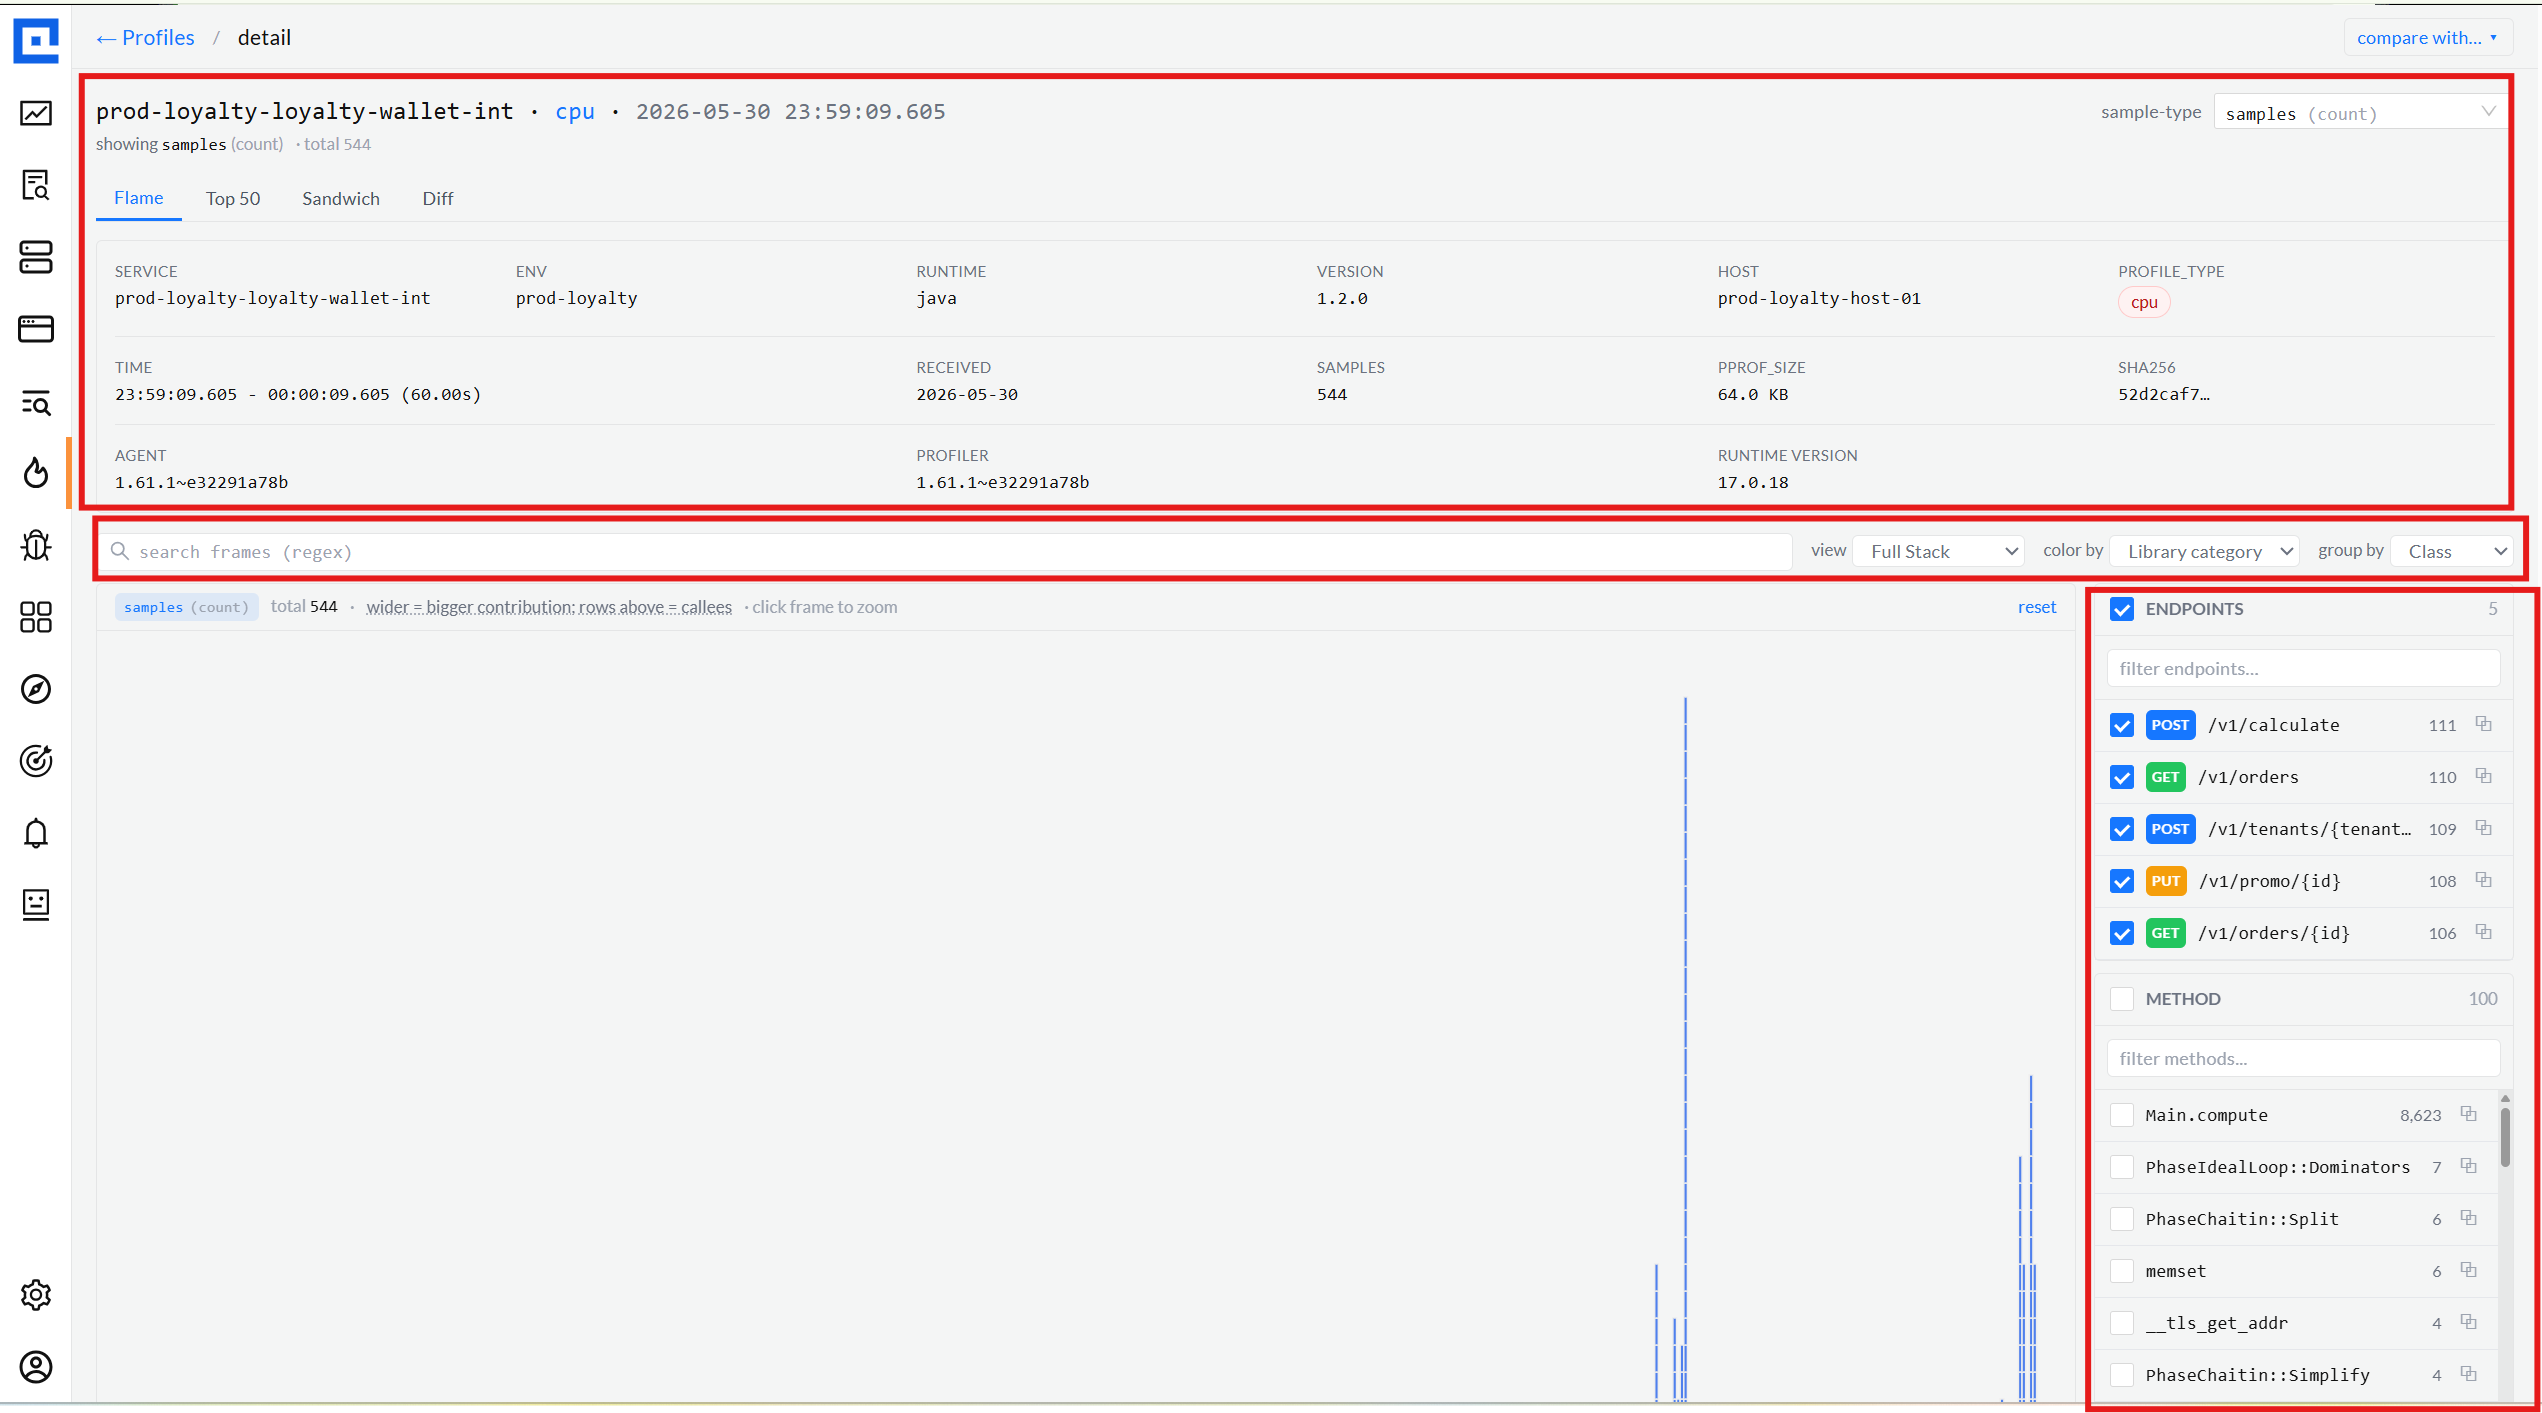
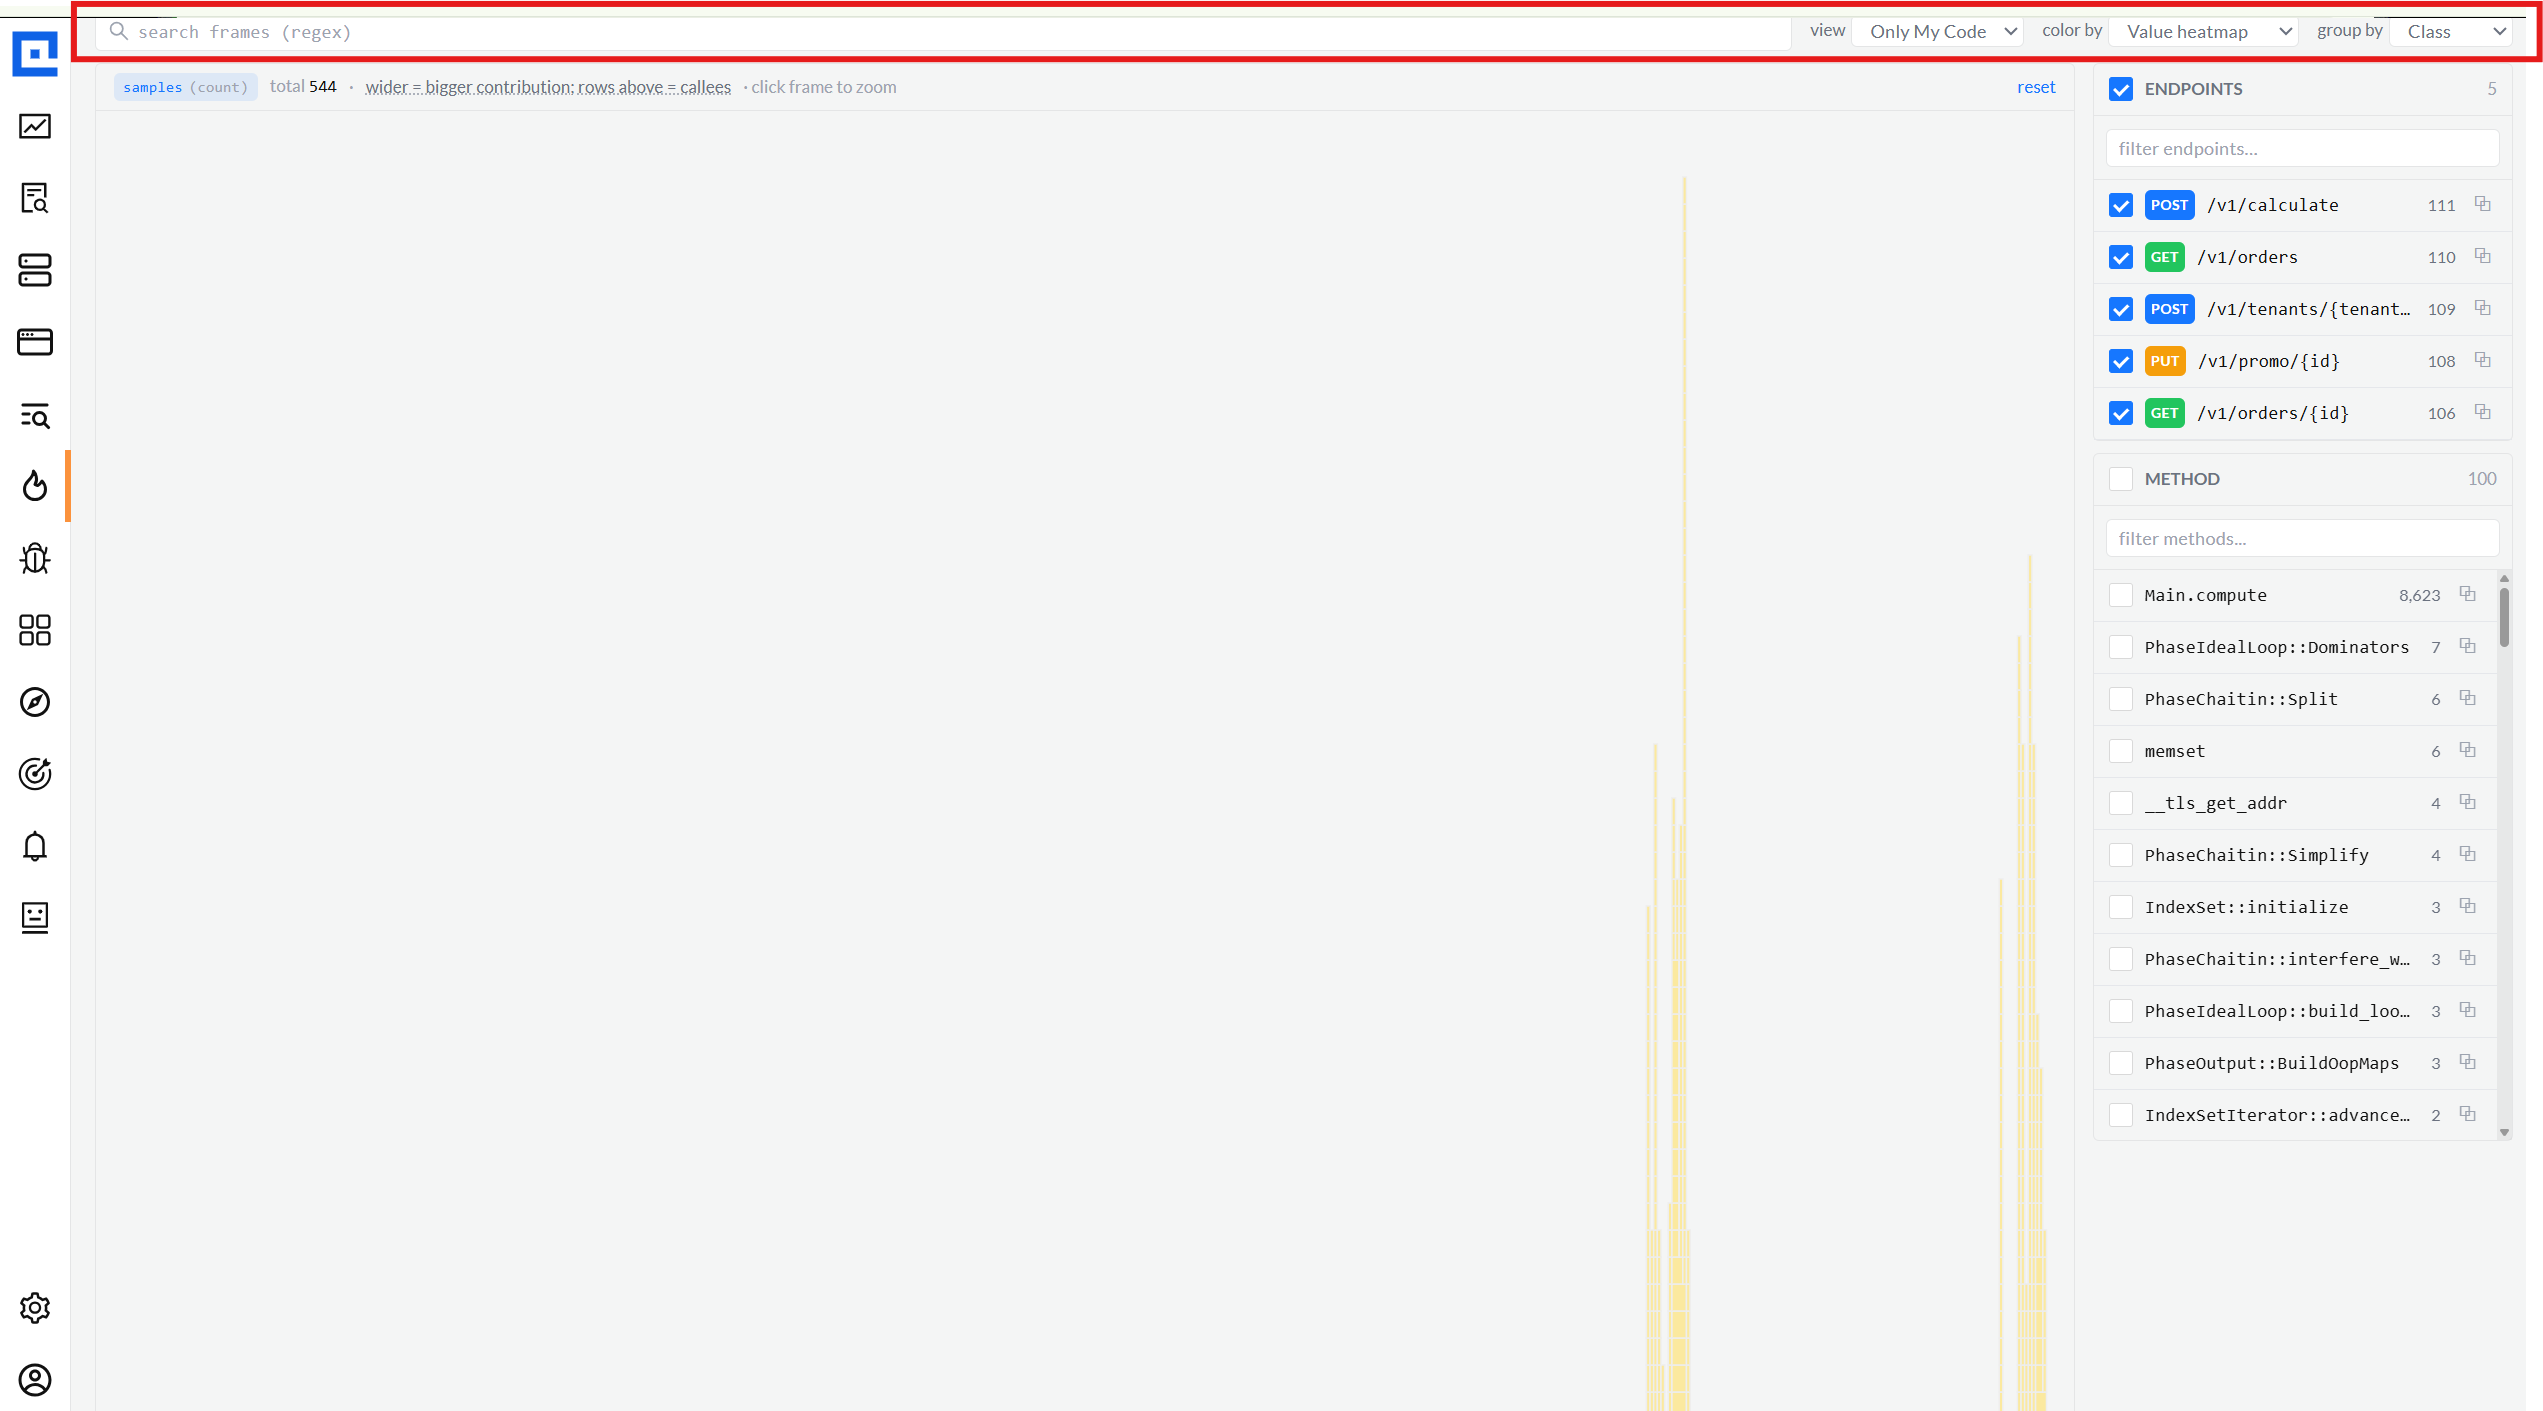
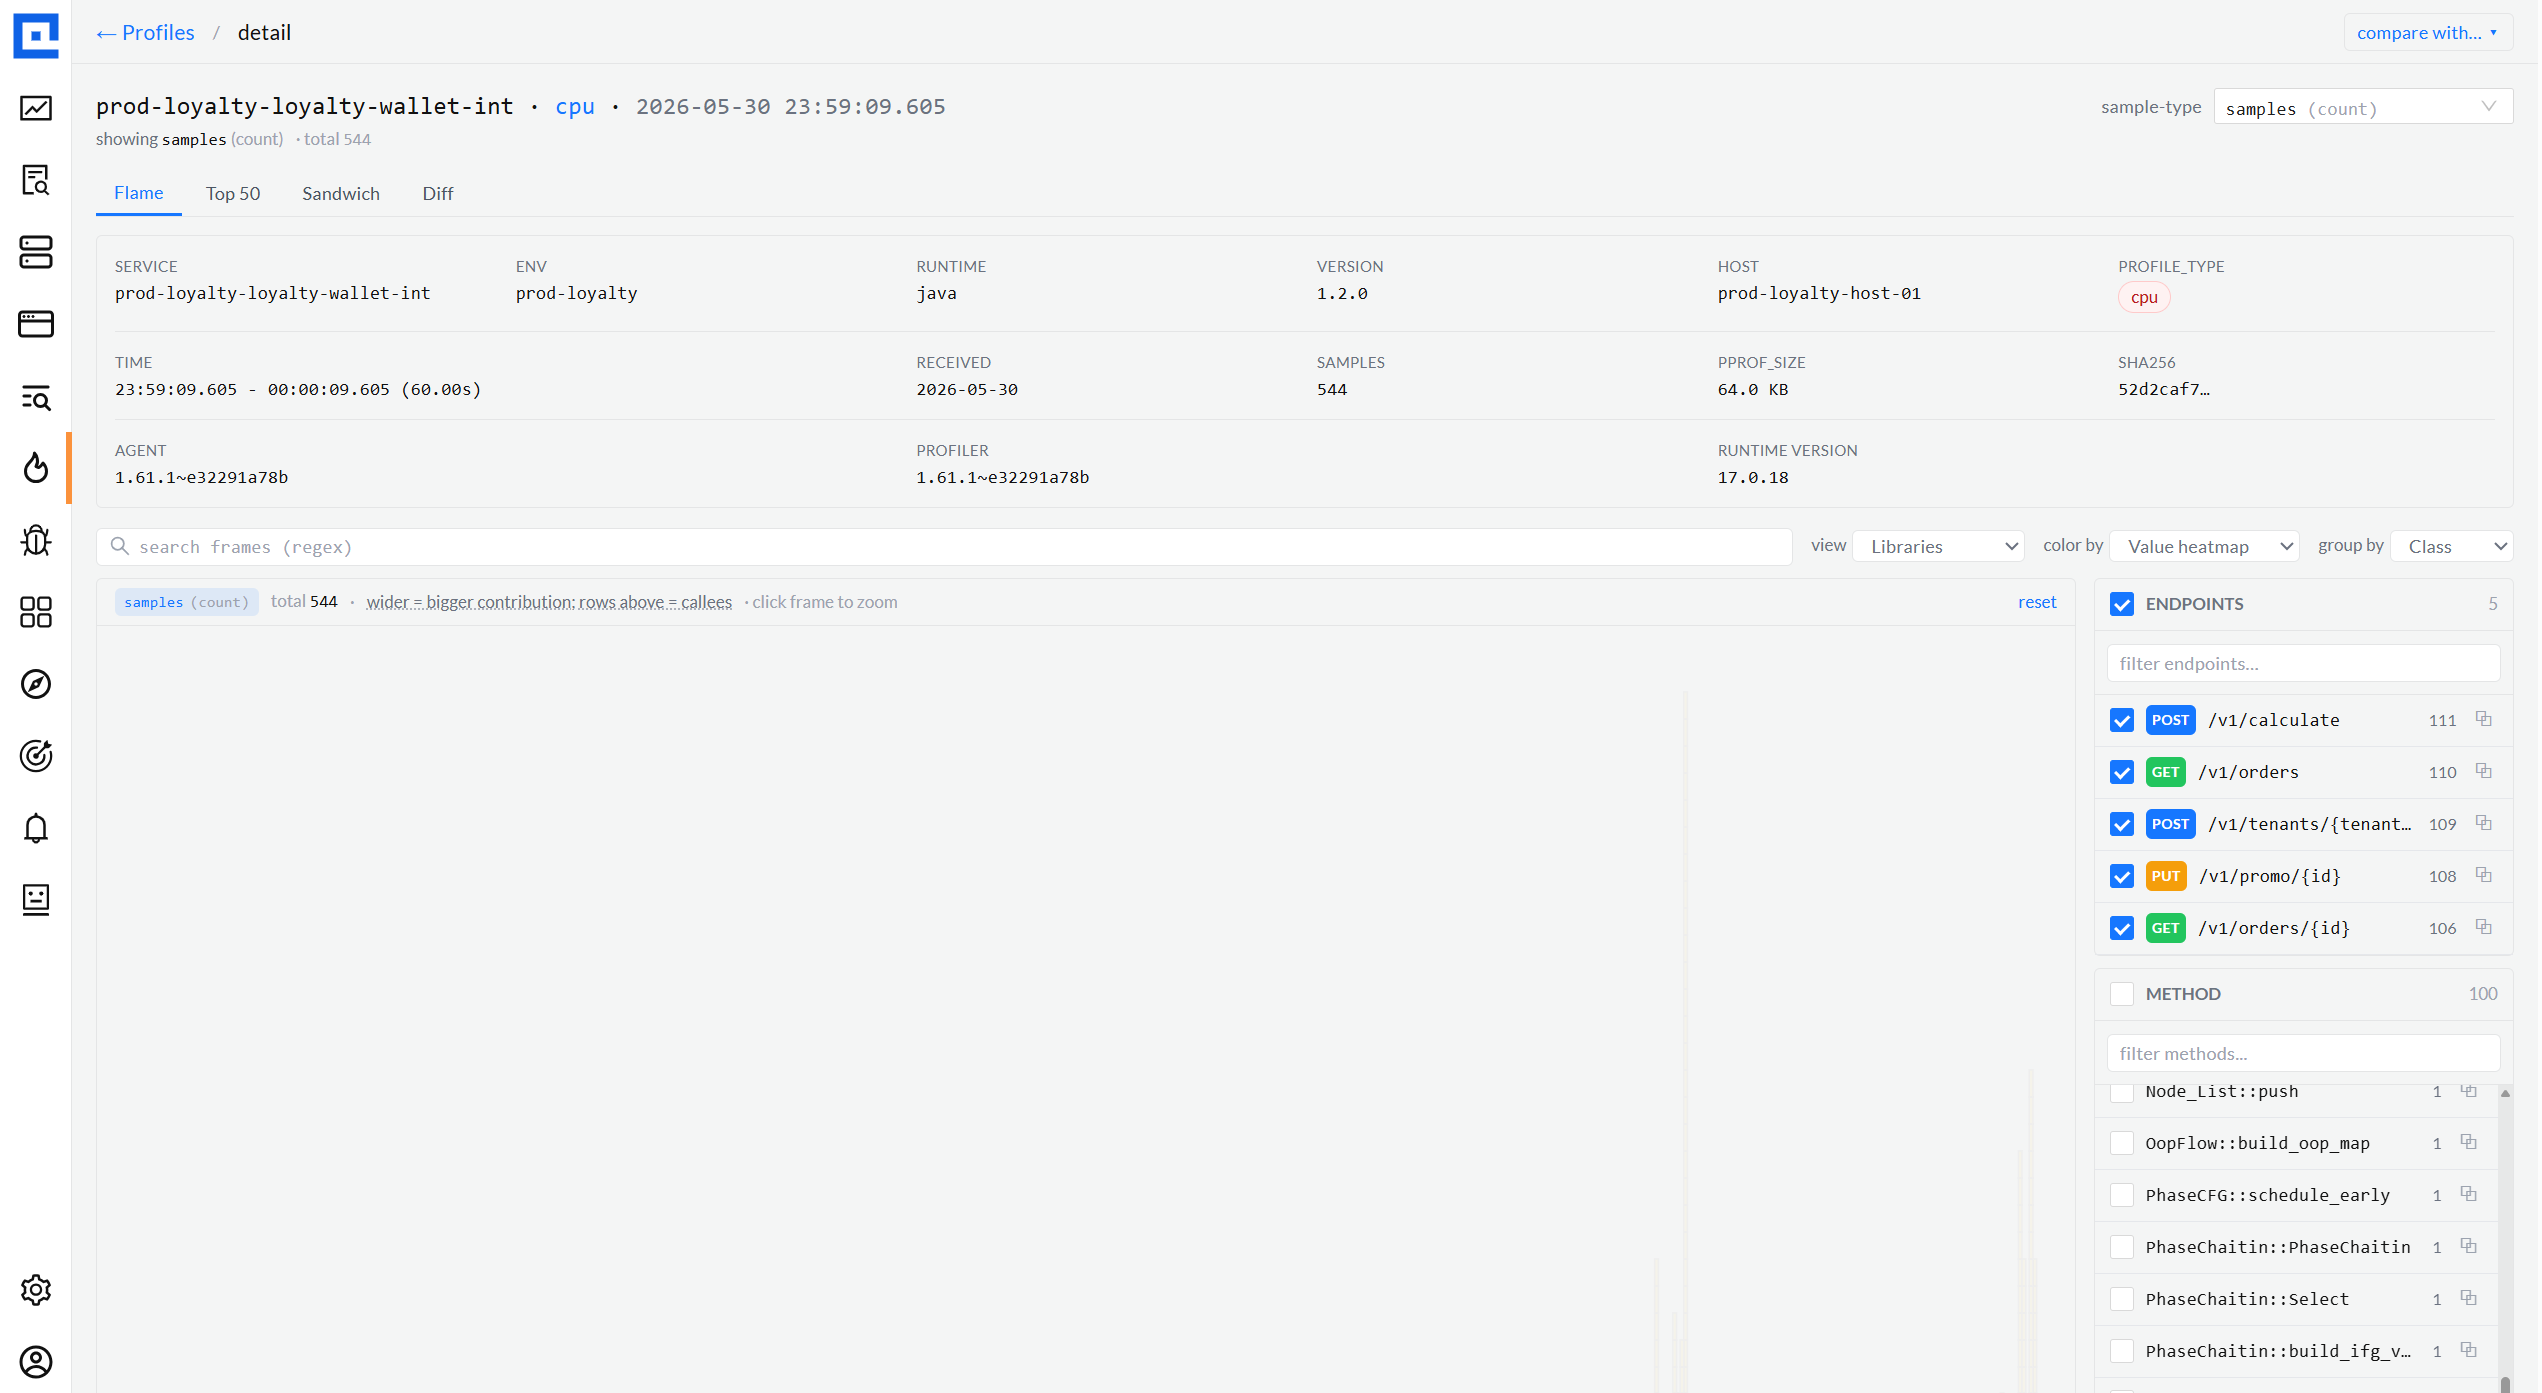
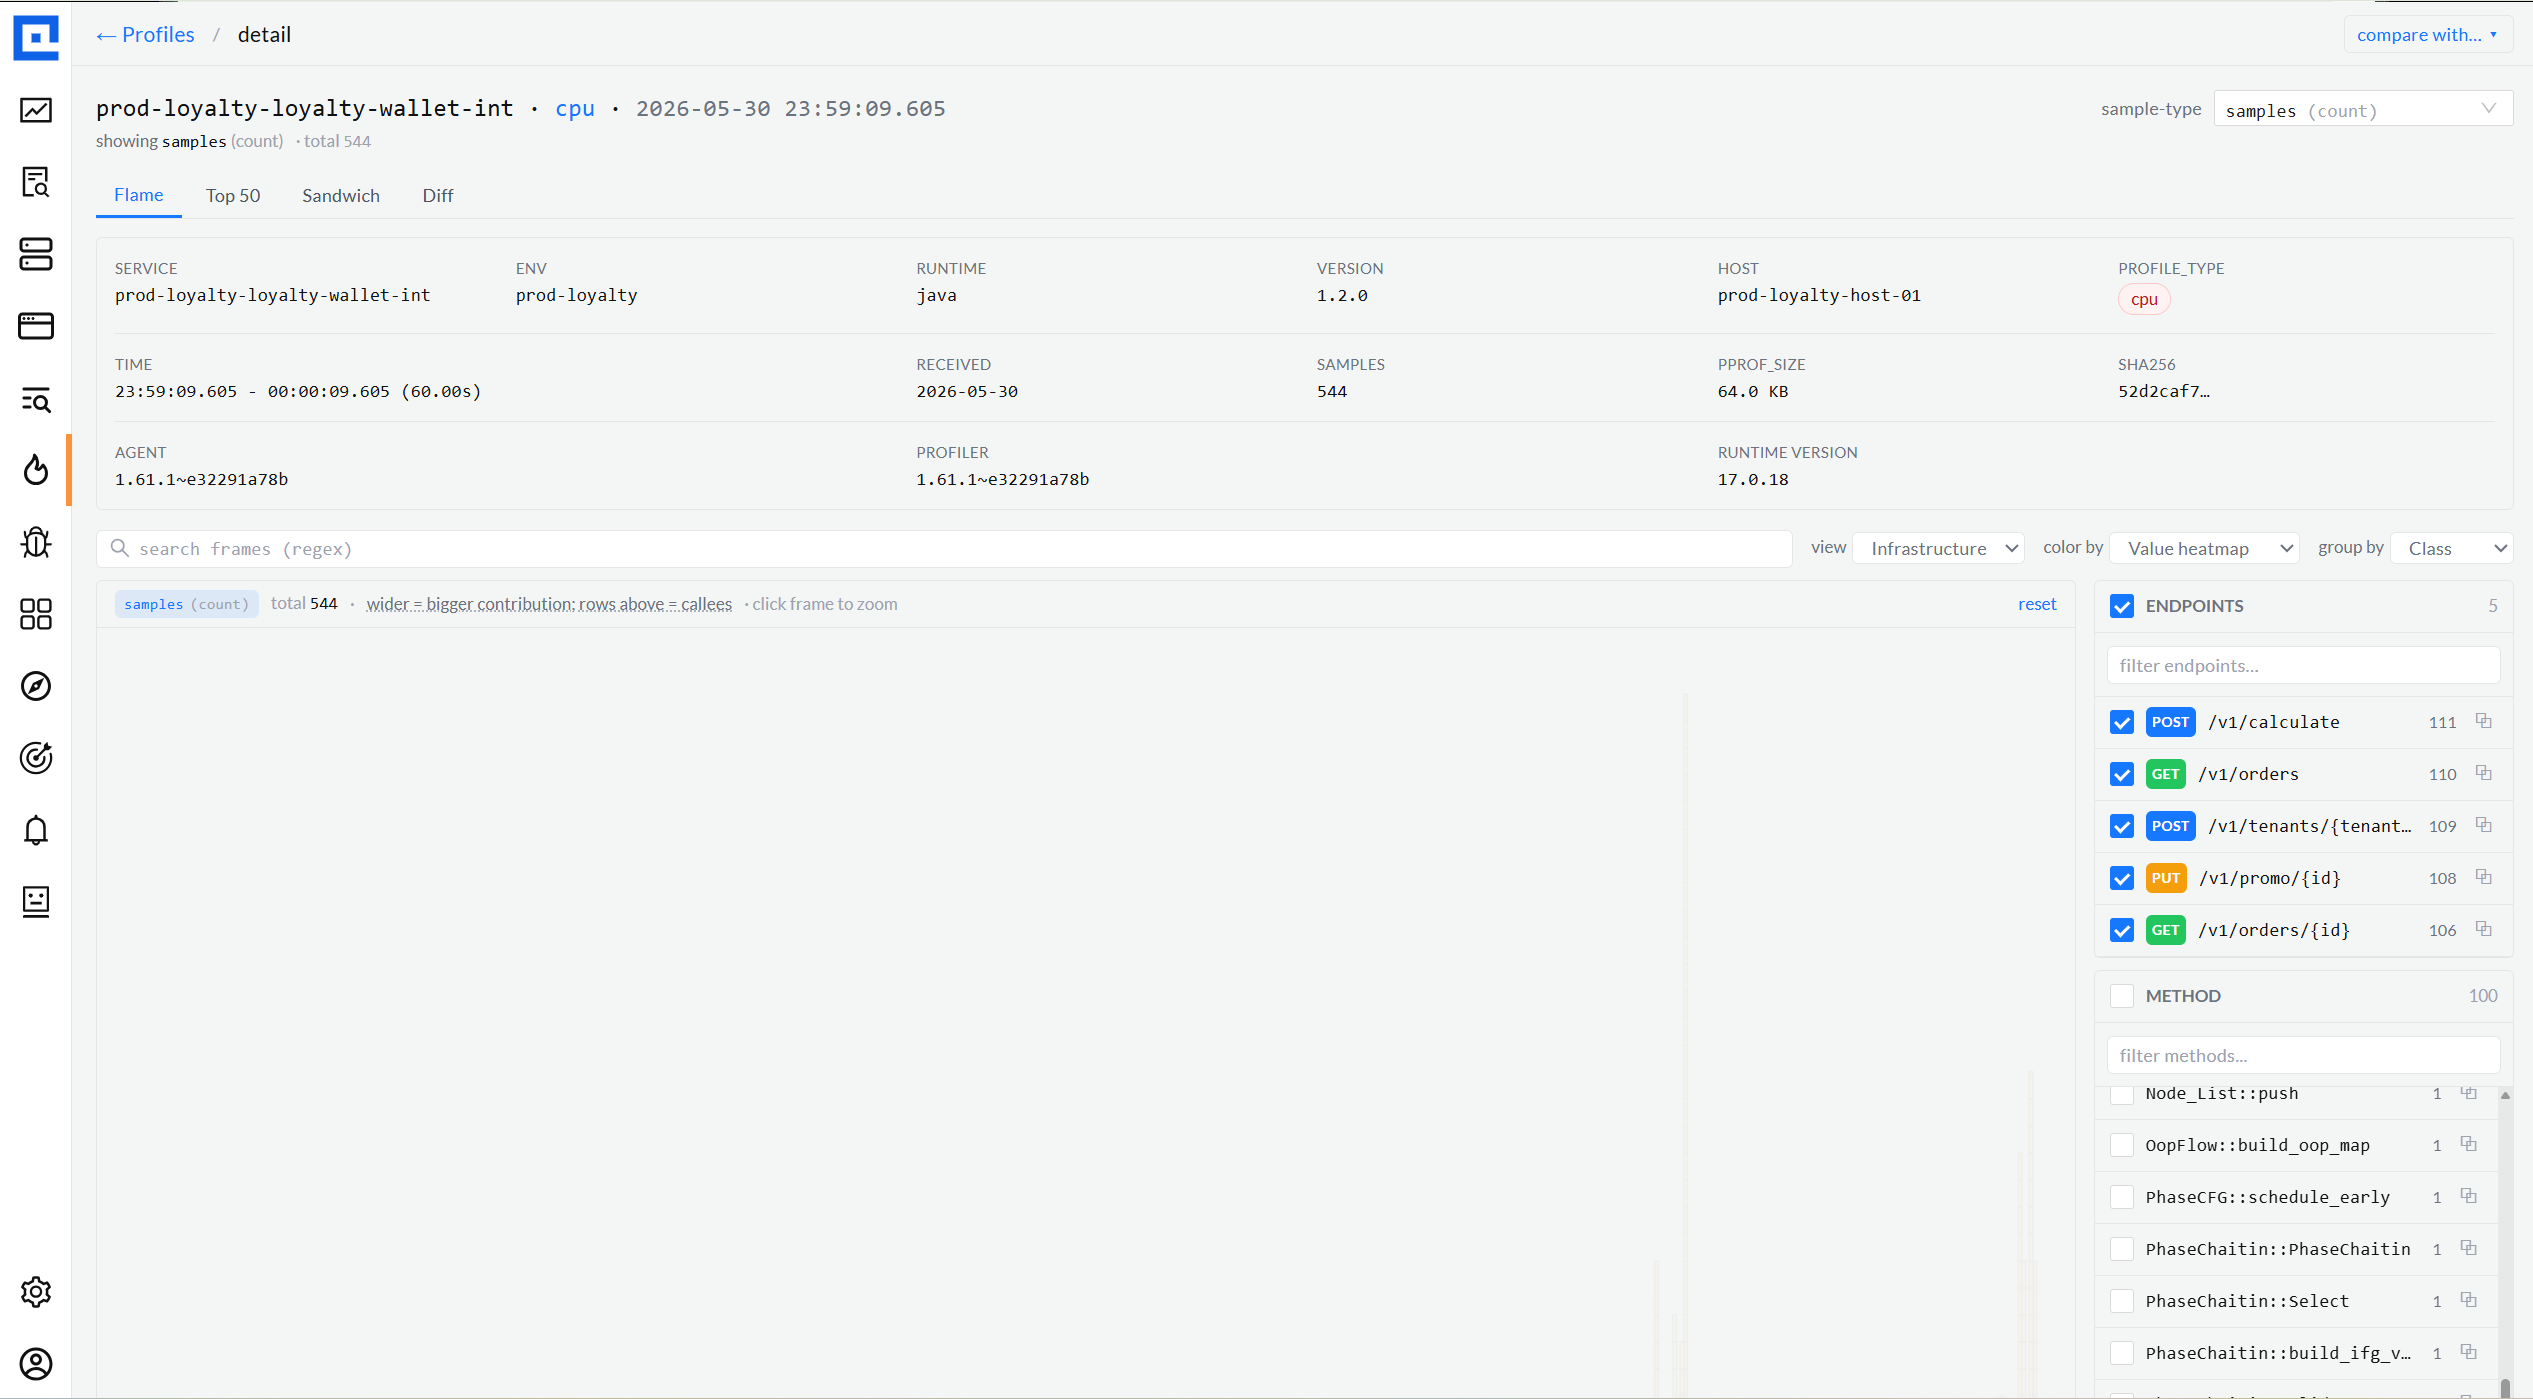
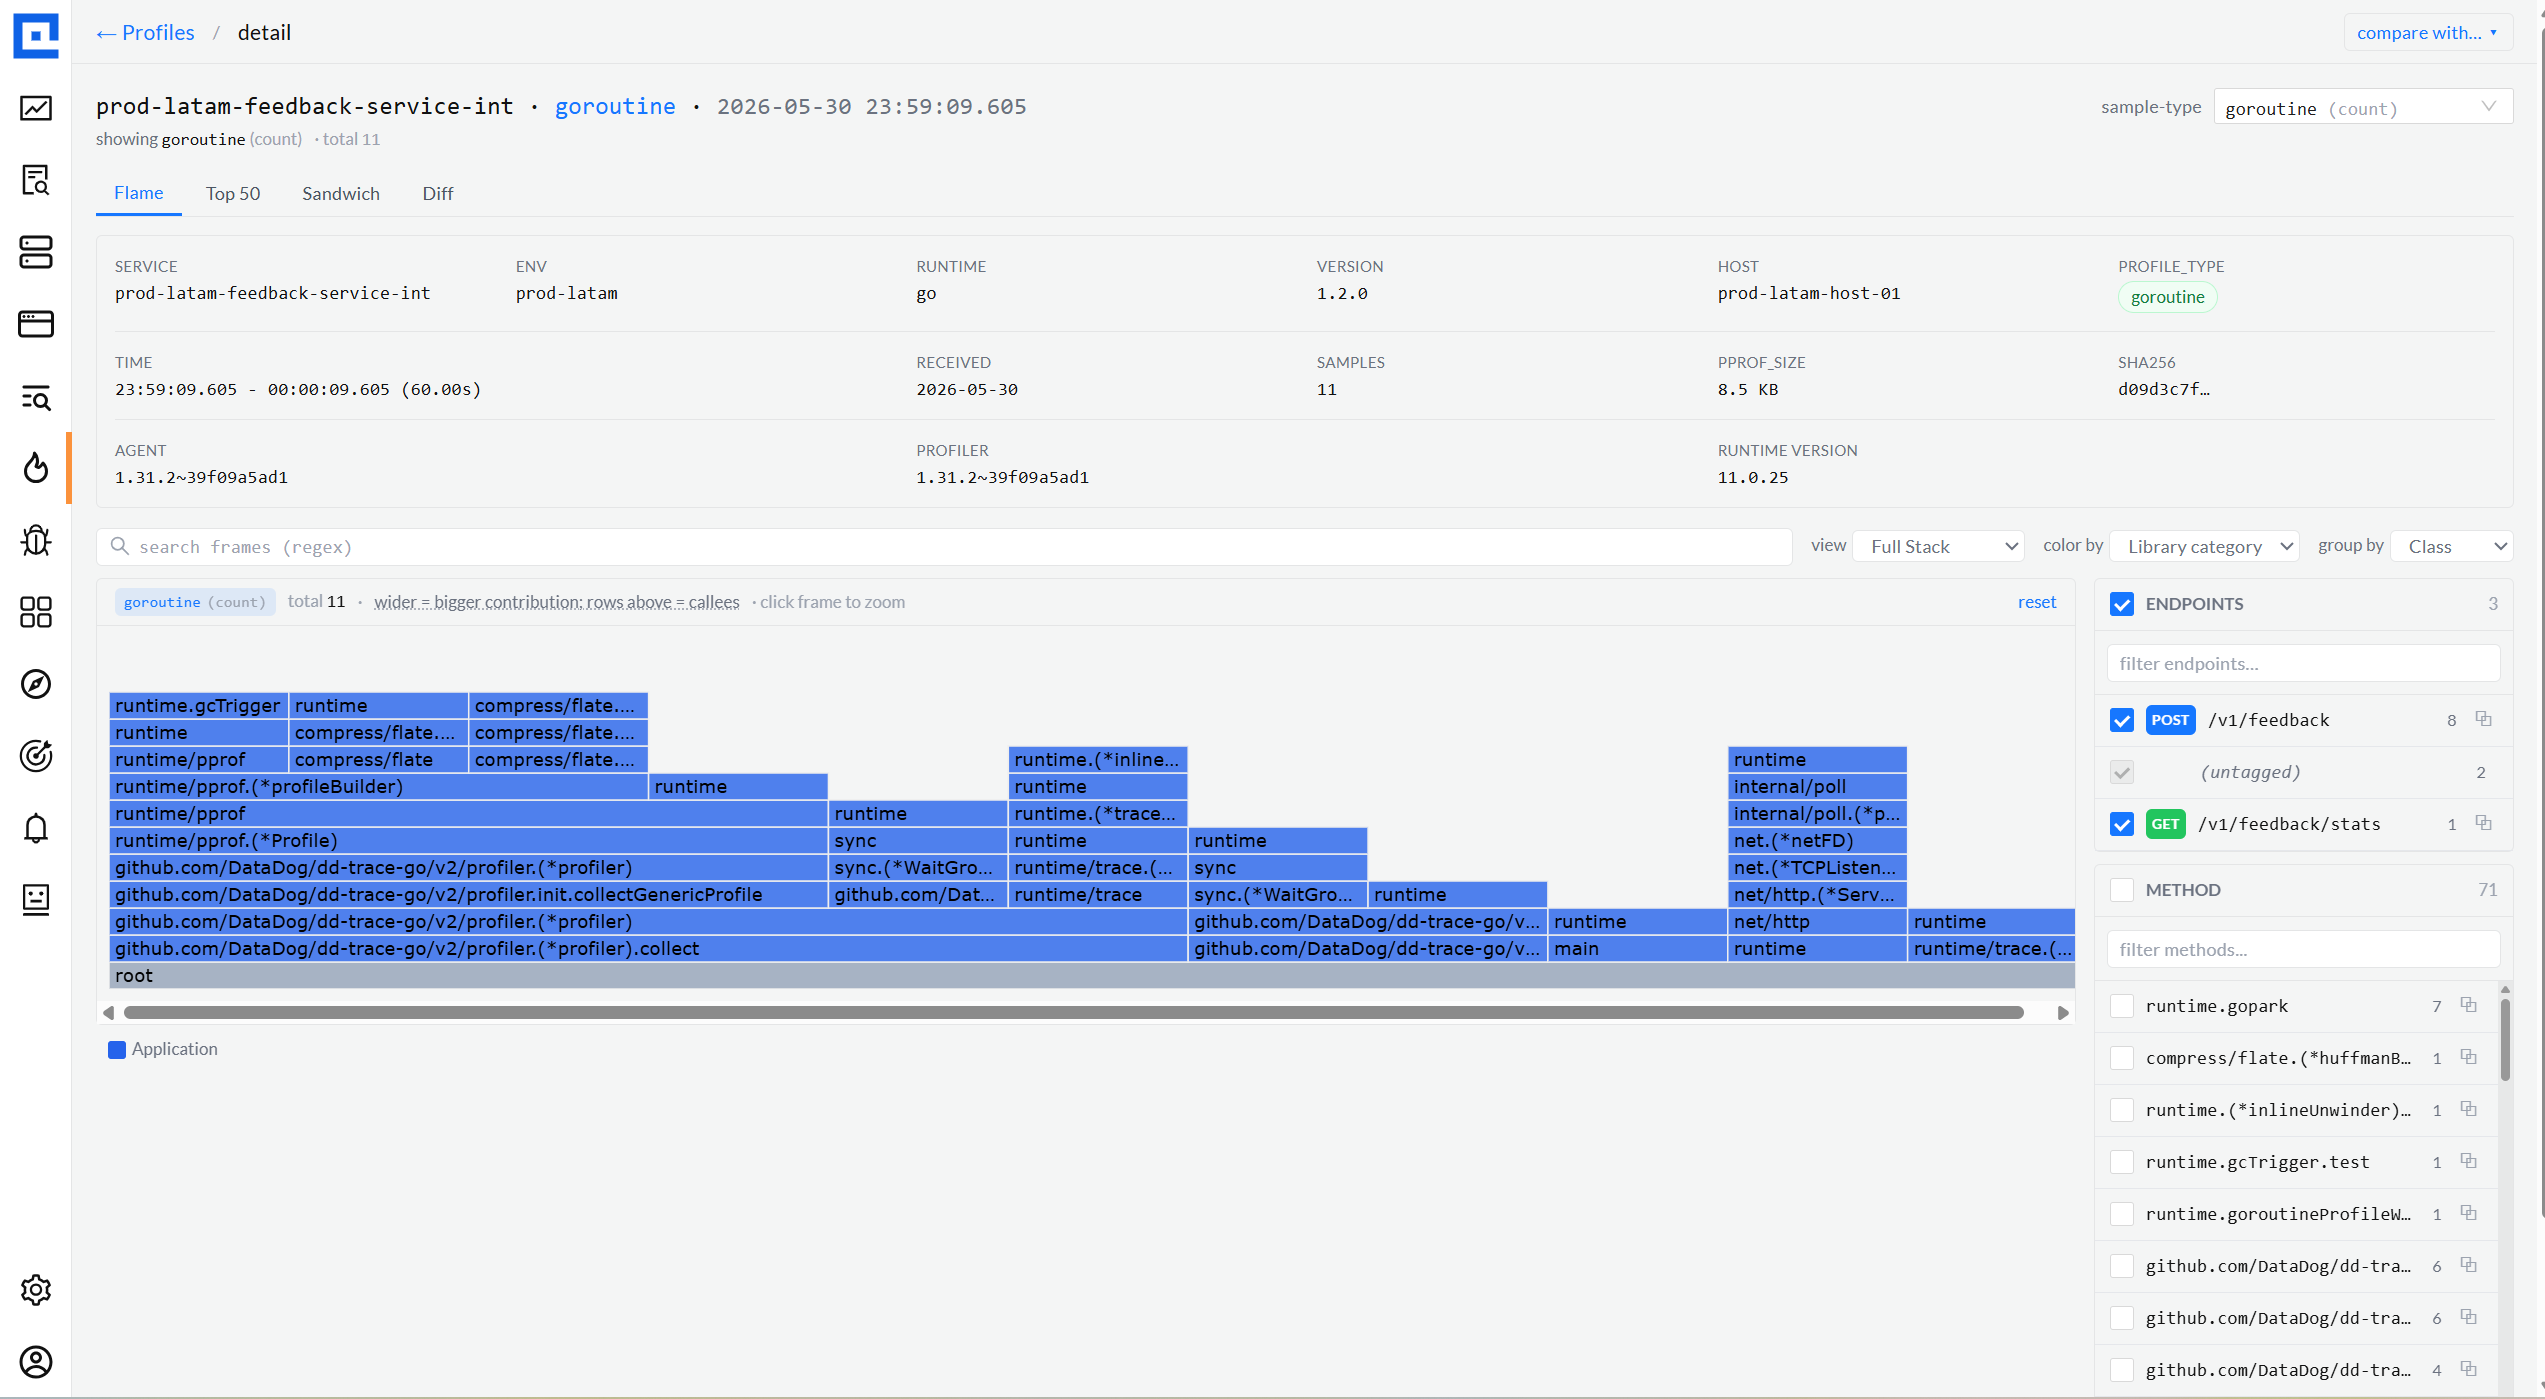
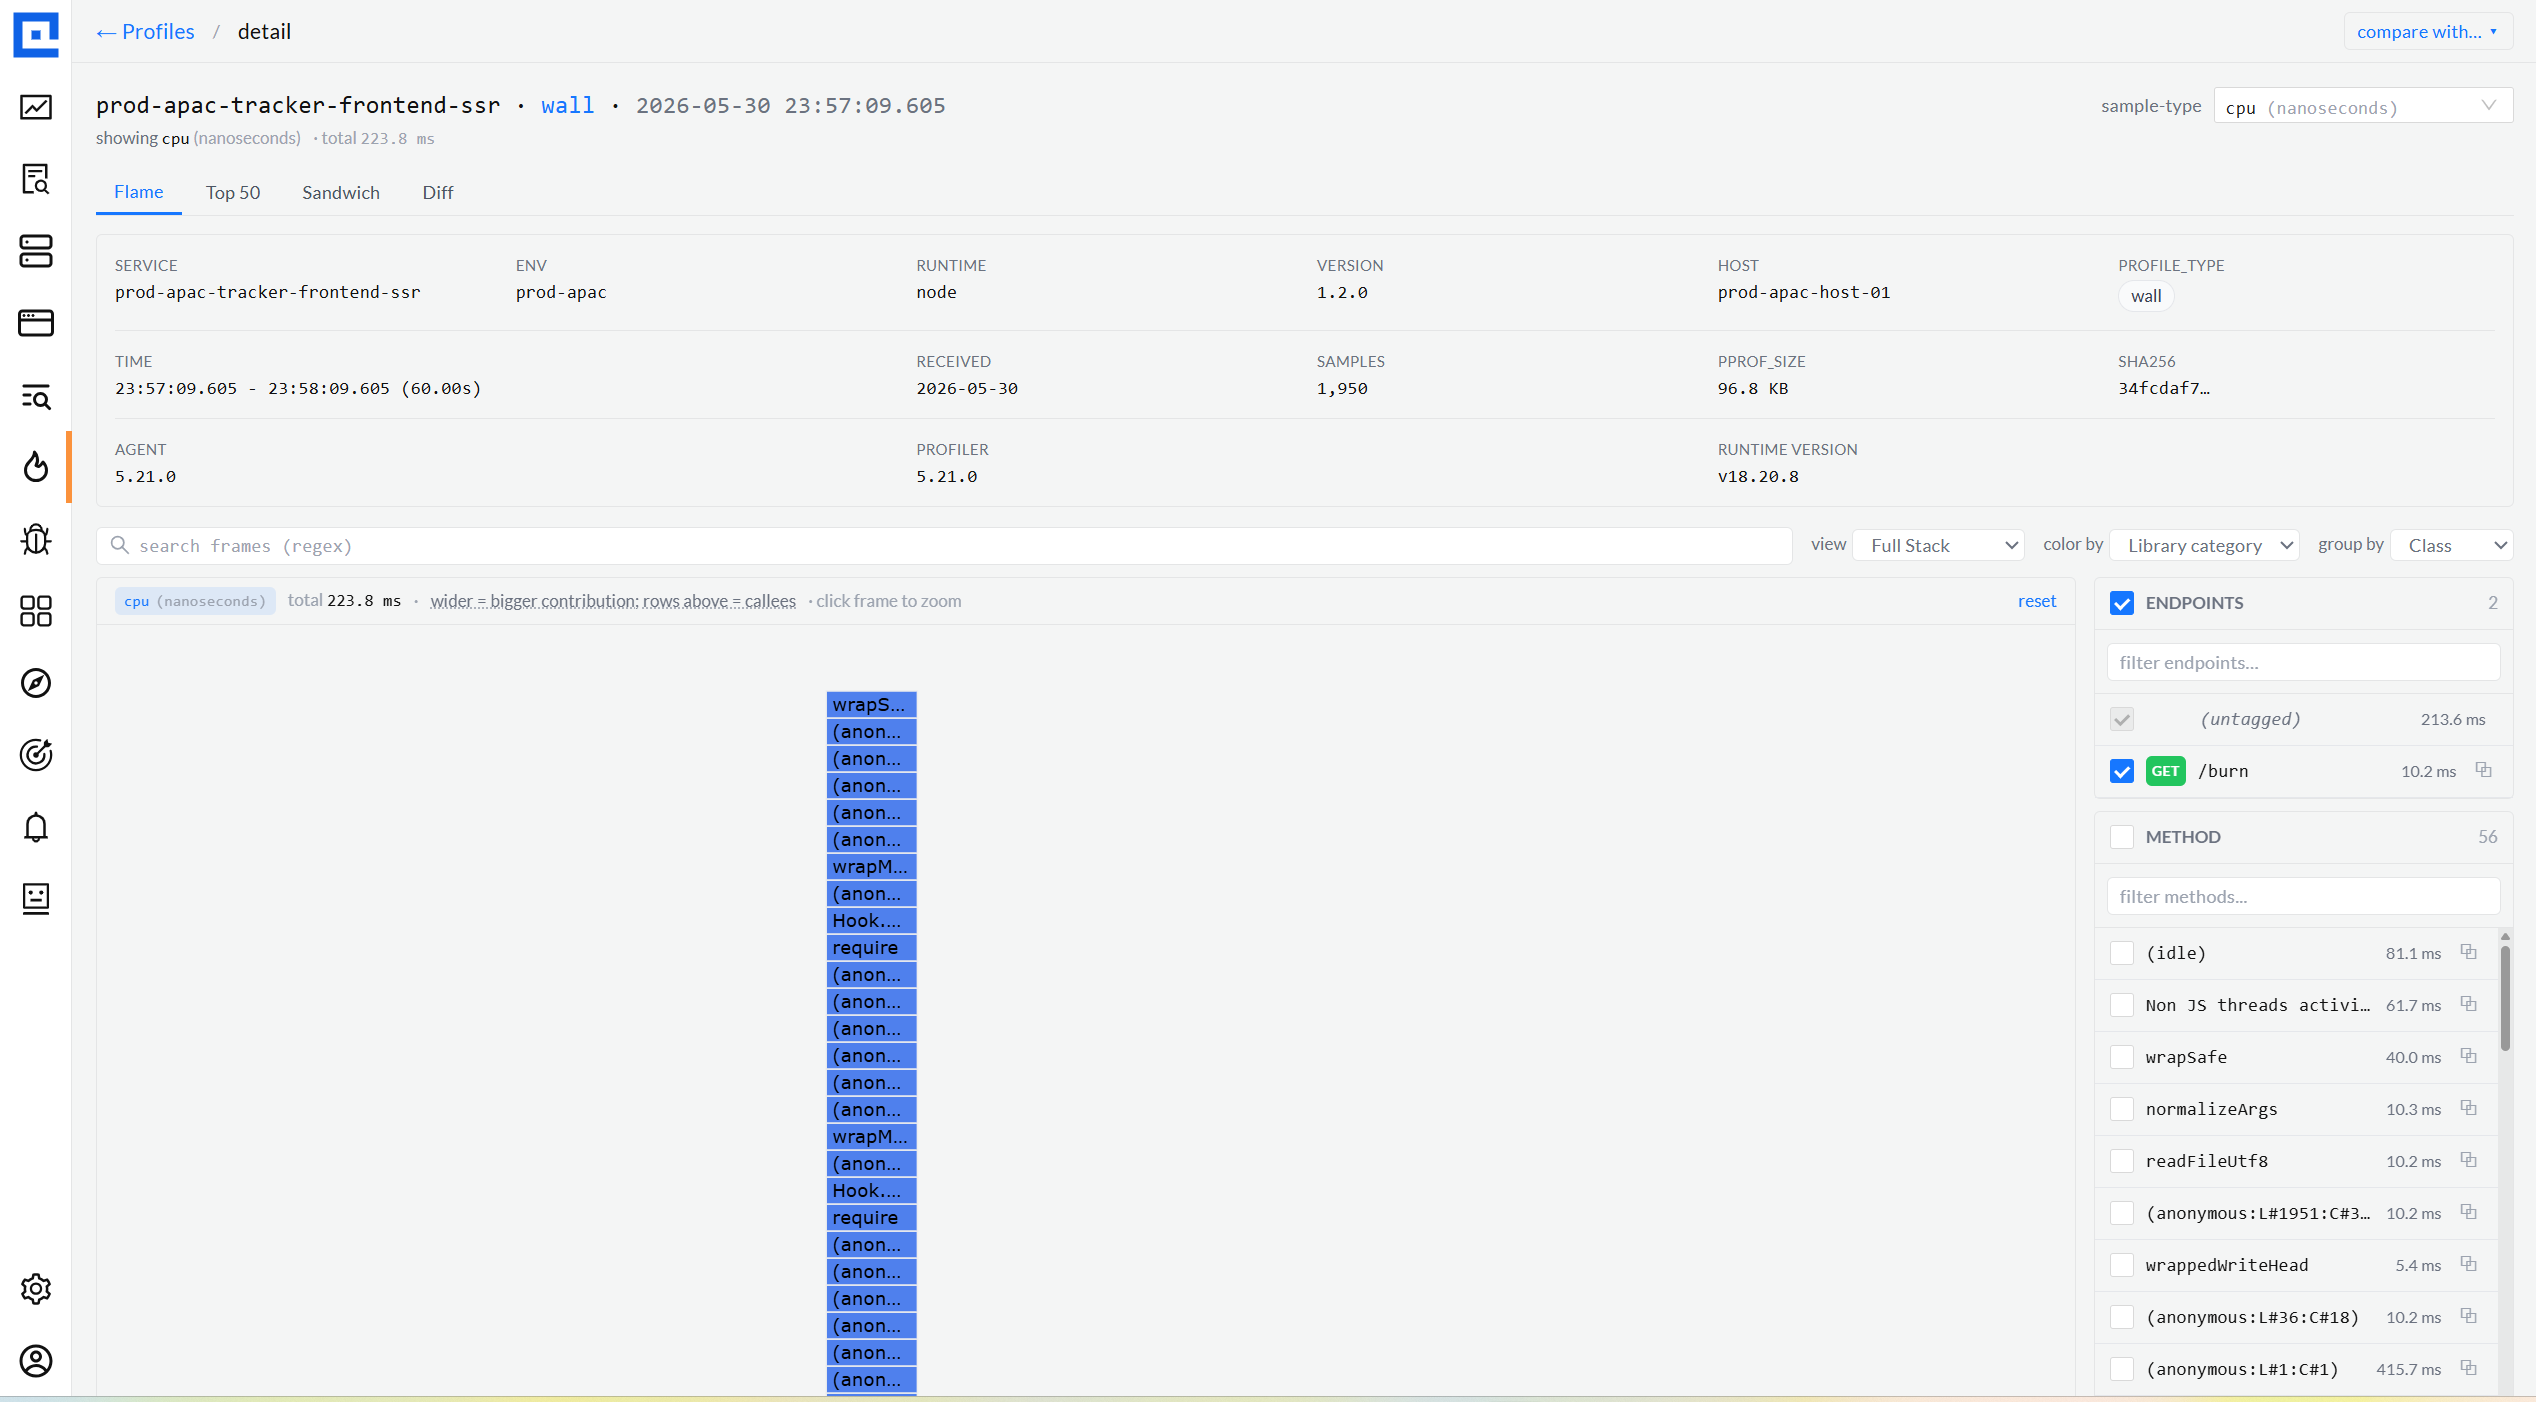
04 · Flame graph
Four views, three color modes, three group-by modes.
The single most-used surface. View dropdown picks the lens (Full Stack / Only My Code /
Libraries / Infrastructure). Color By switches the palette (Library category / Value
heatmap / per-Function hash). Group By collapses frames (Method / Class / Package).
Every combination is URL-bound so links into a specific lens always reproduce.
View: Full Stack · Color: Library category · Group: Class
Only My Code · Value heatmapview
Libraries · Value heatmapview
Infrastructure · Value heatmapview
Only My Code · scrolled flameview
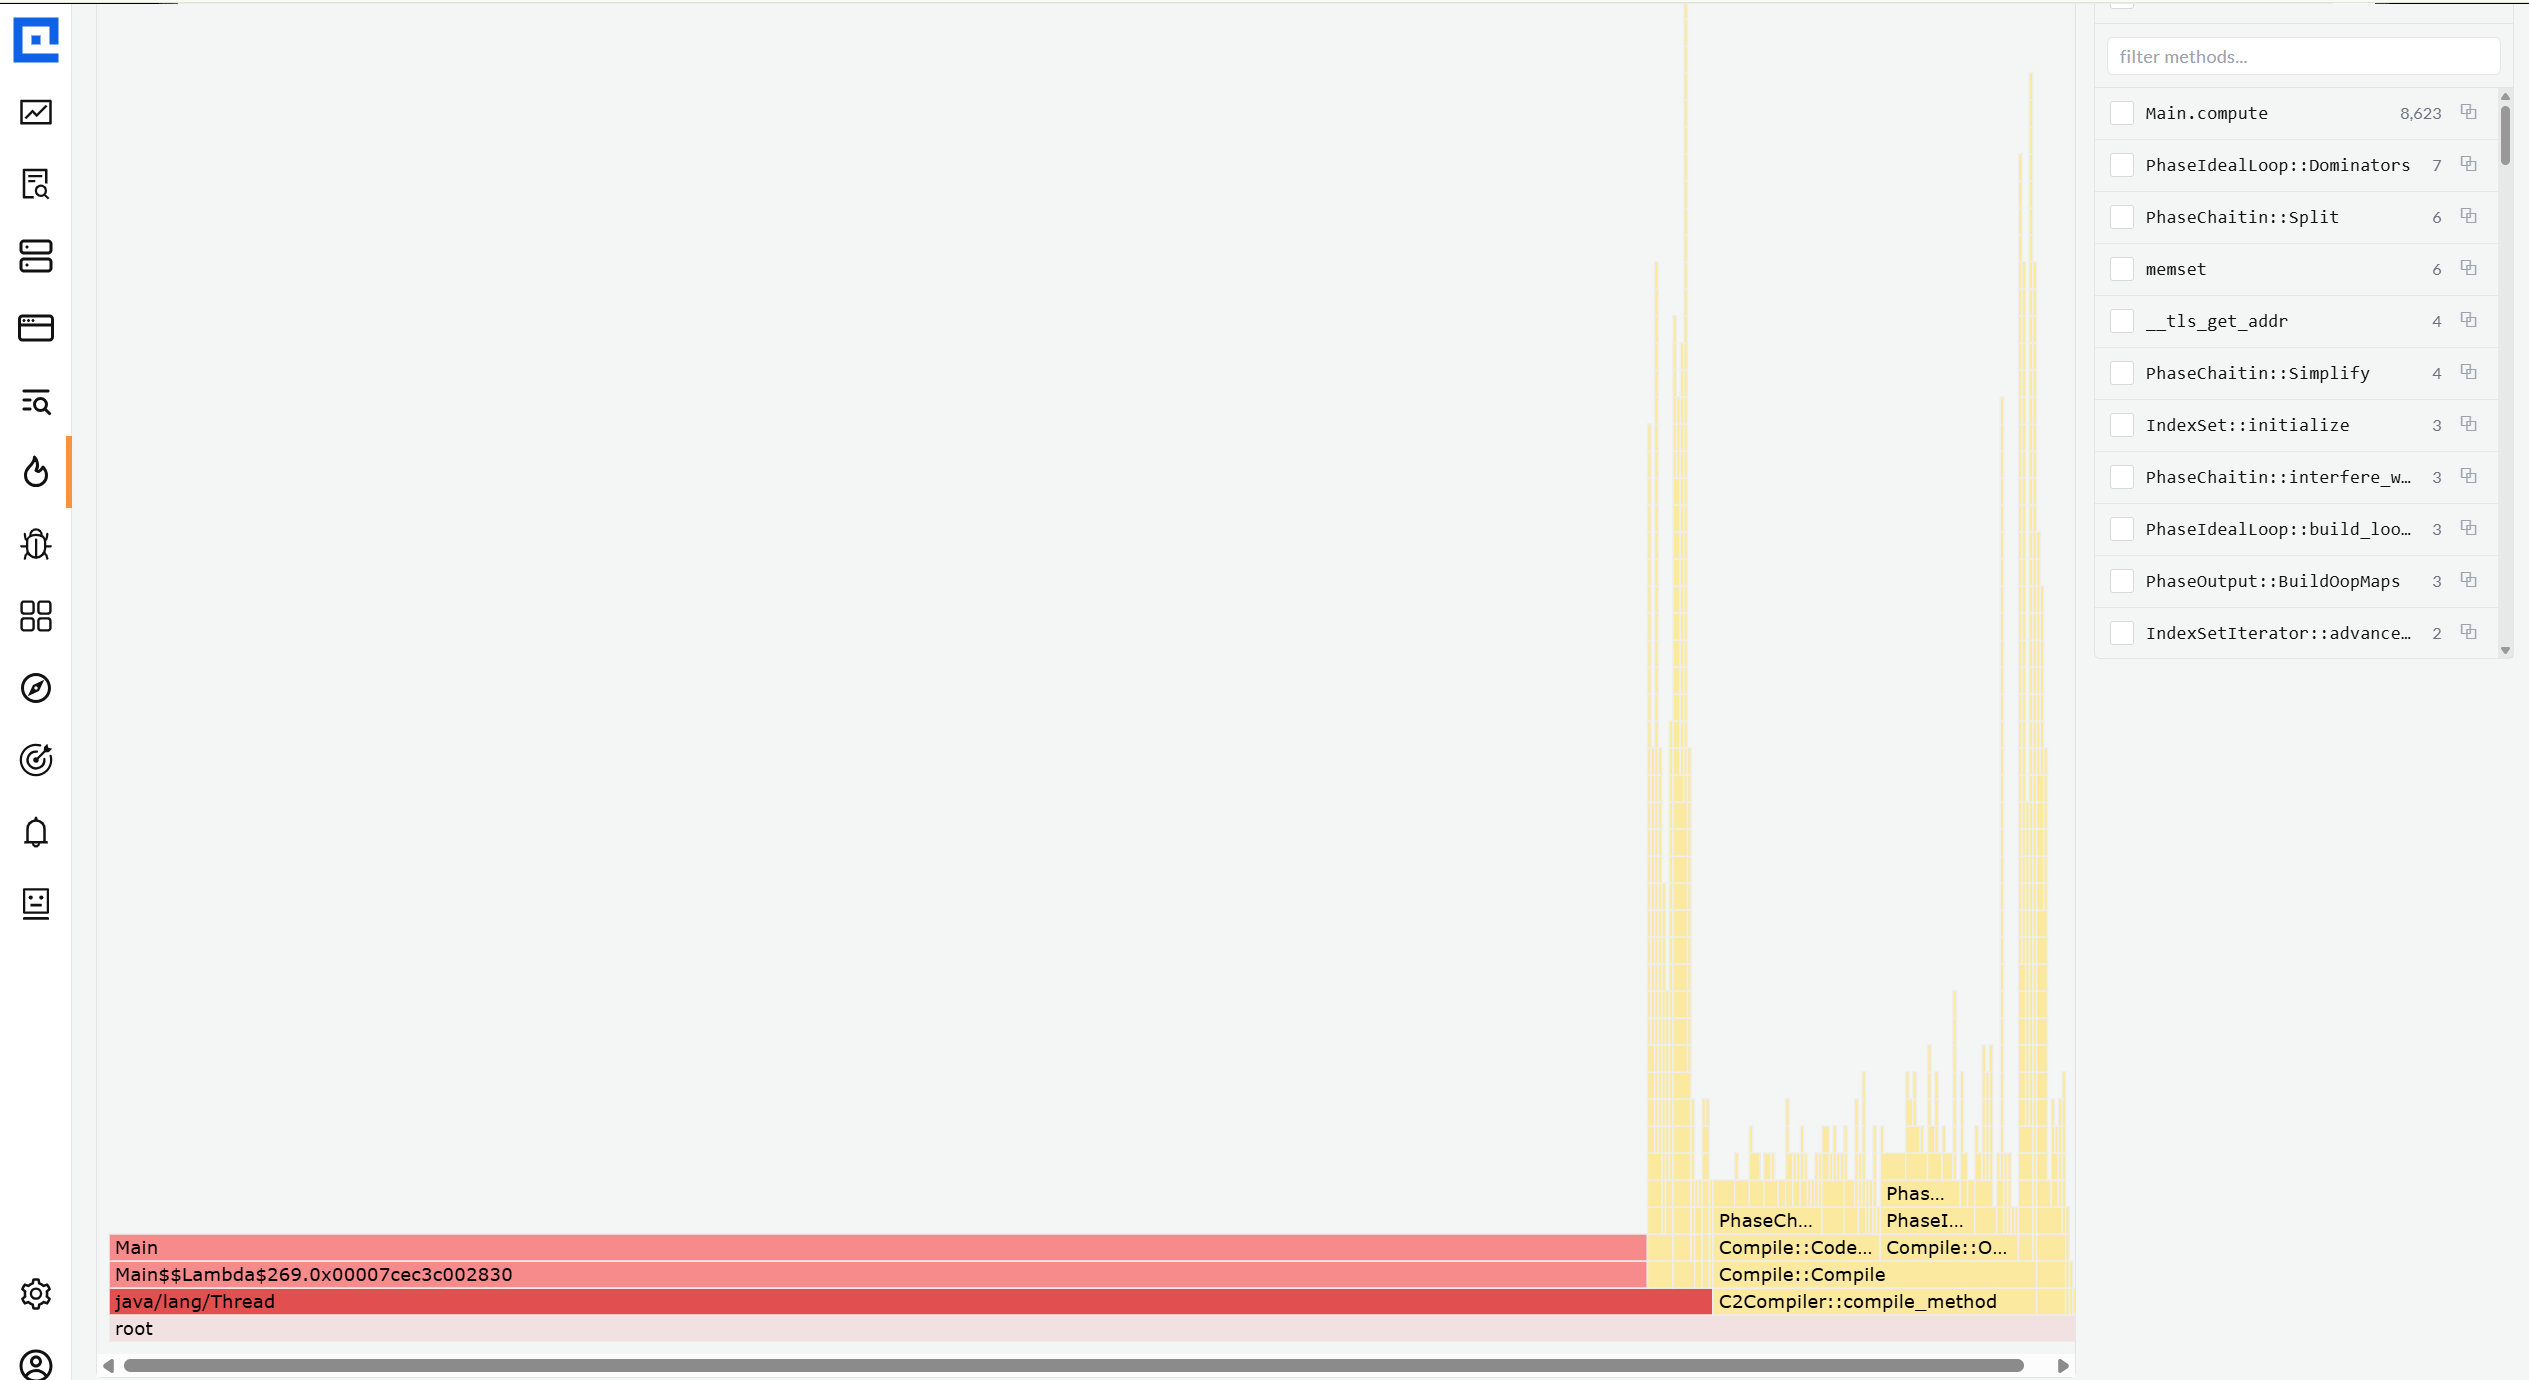
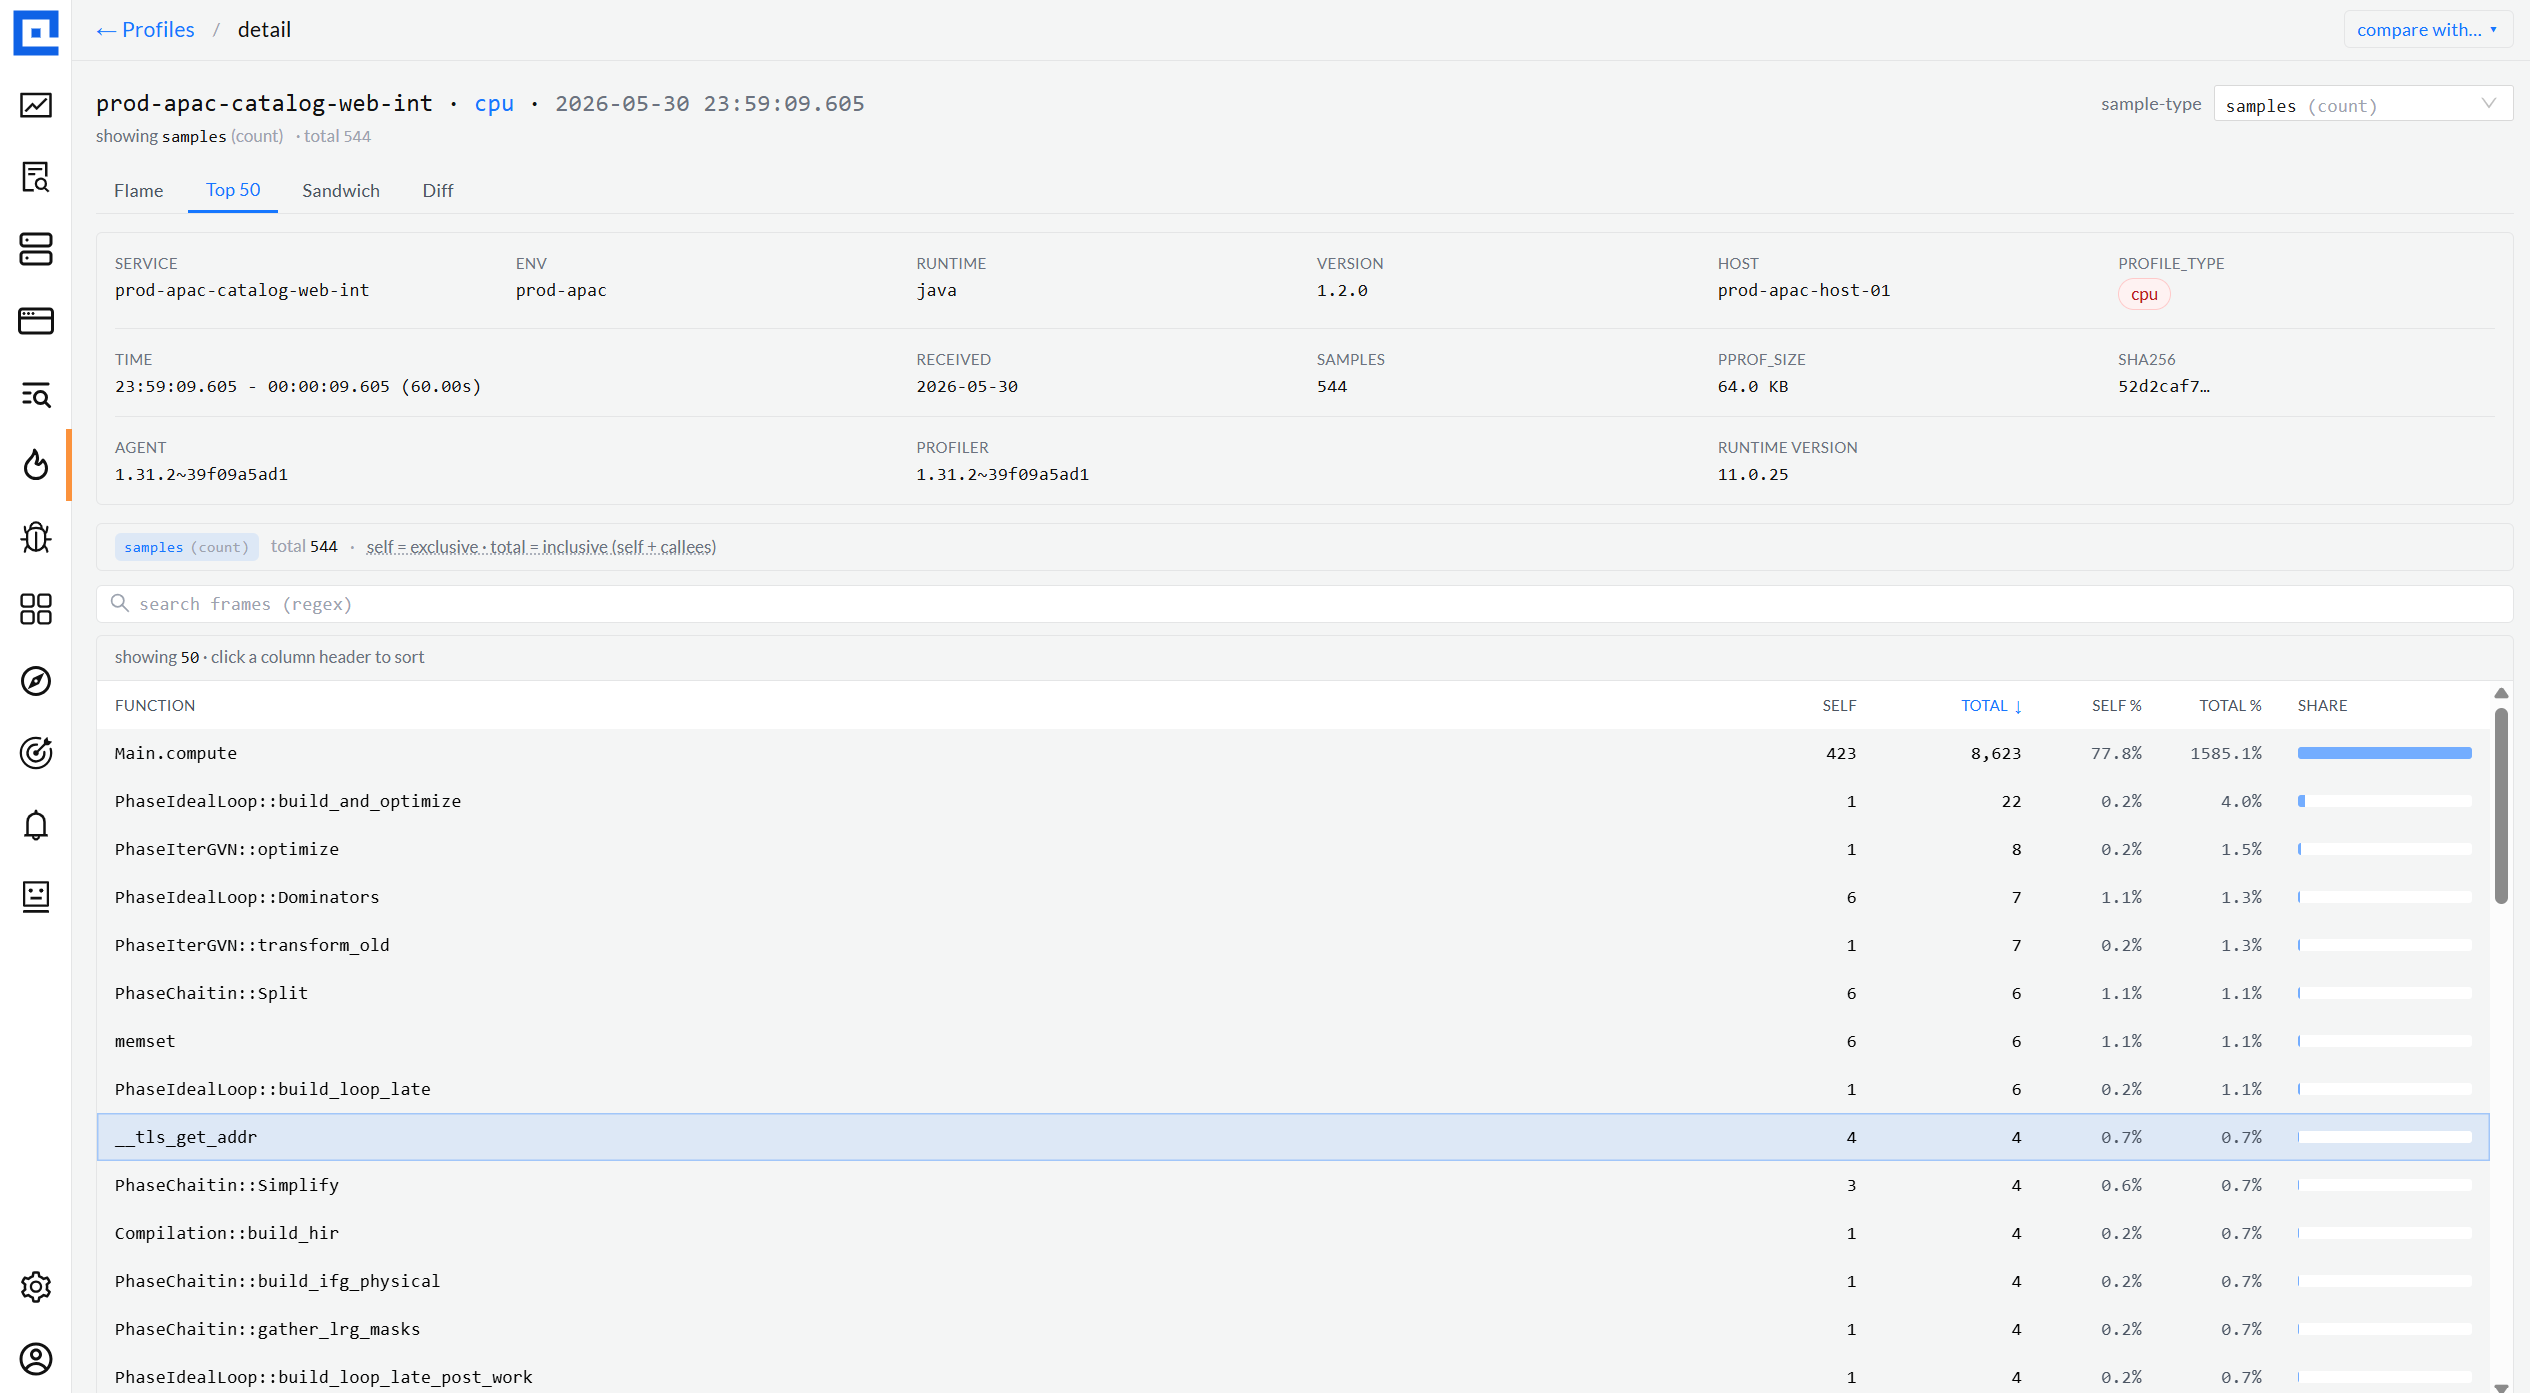
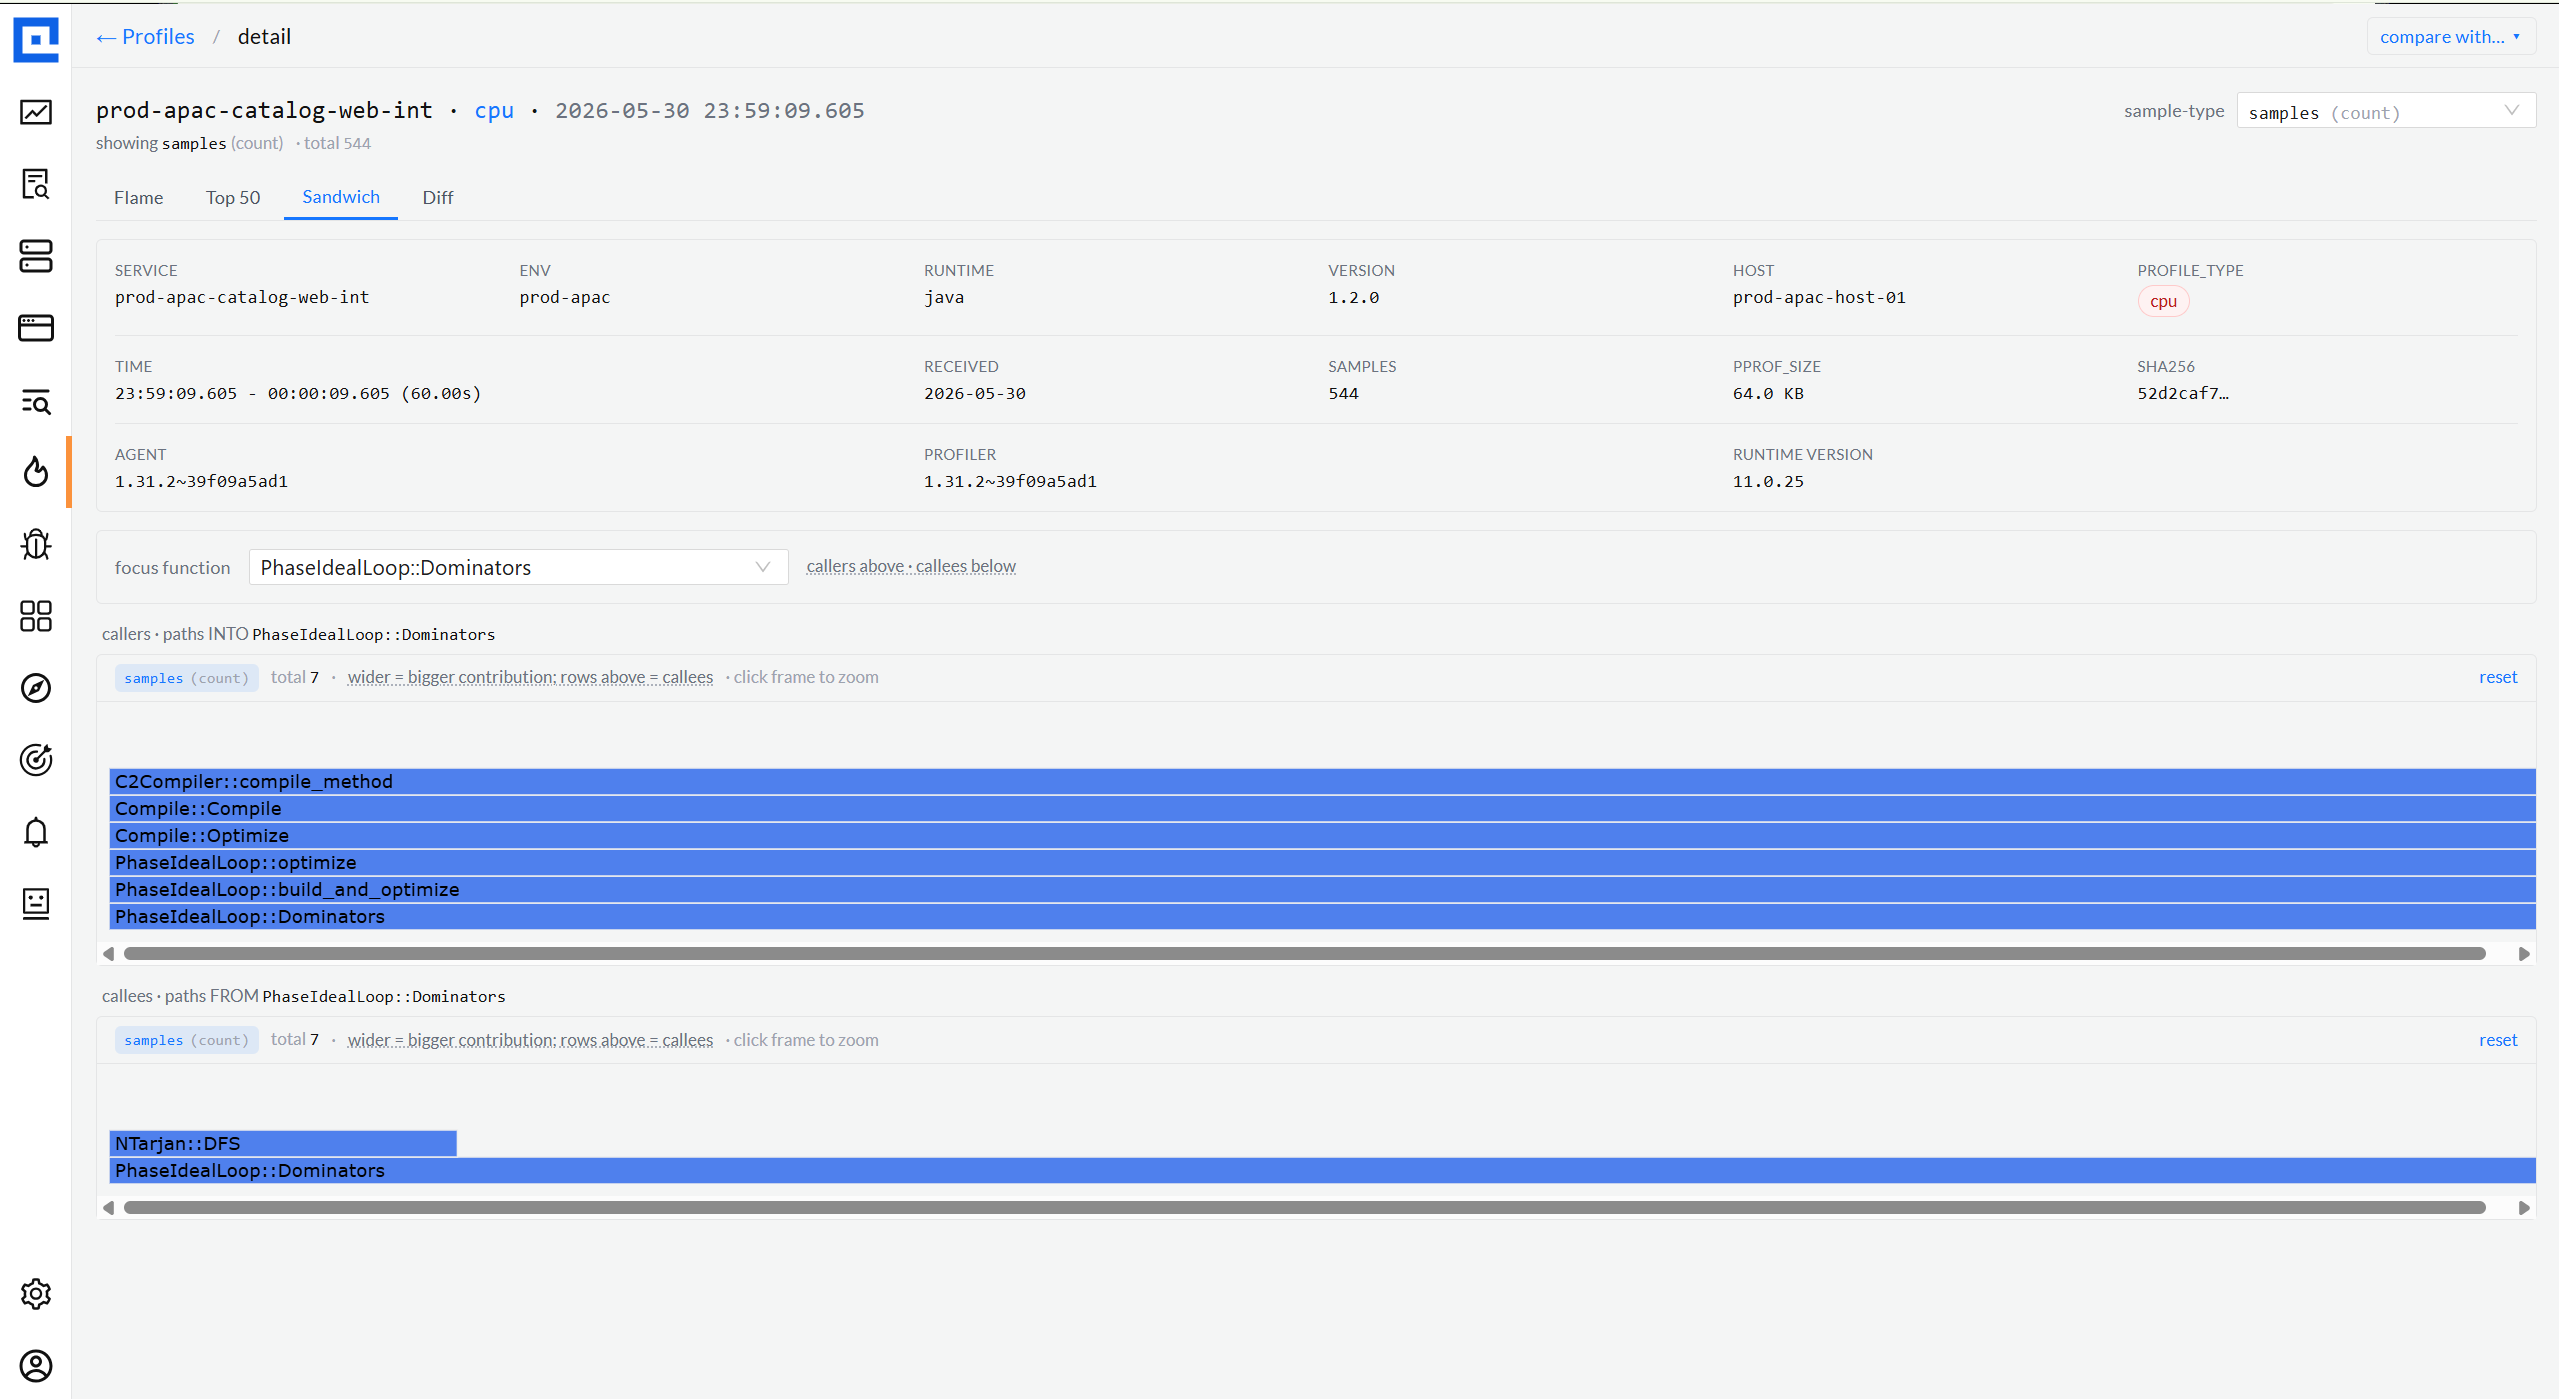
05 · Top-50 + Sandwich
From flame to table when you need the ranked view.
Top-50 sorts methods by self / total / share. Sandwich pivots on any single function
and shows callers above + callees below - the classic perf-investigation move when you
know what you're hunting for. Both ride on the same flame data; no extra fetch.
Top 50 · ranked by Selftable
Sandwich · callers + calleespivot
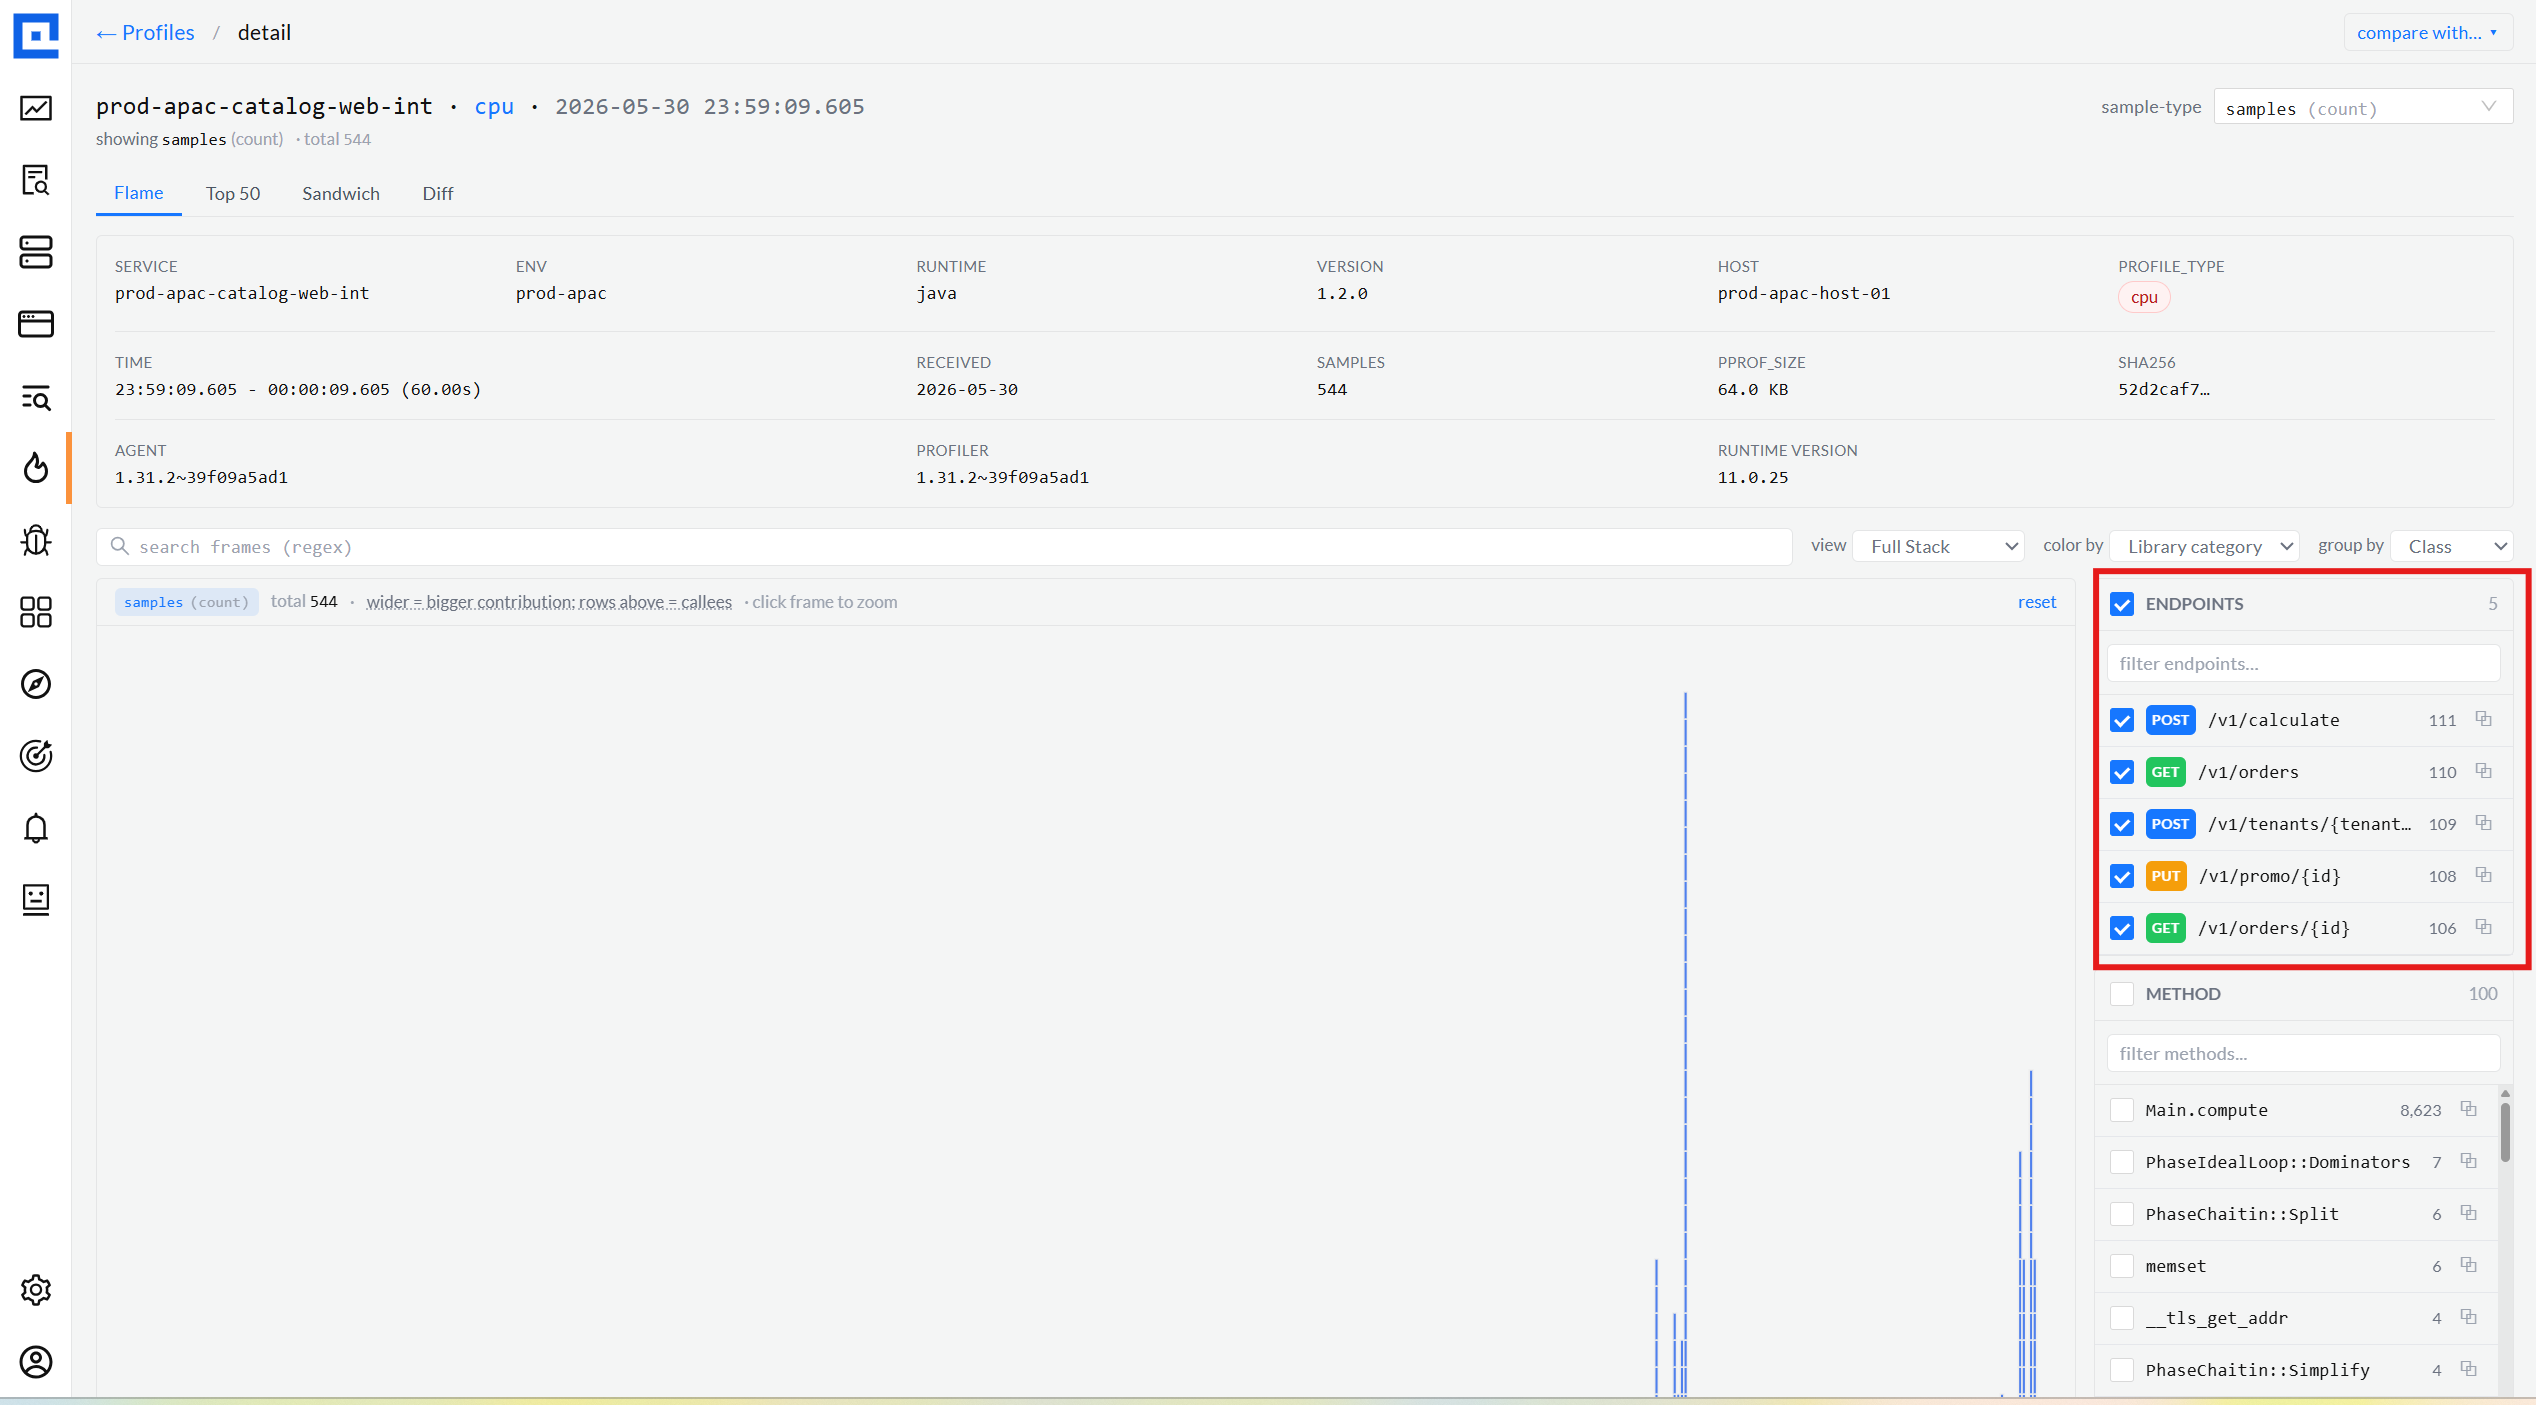
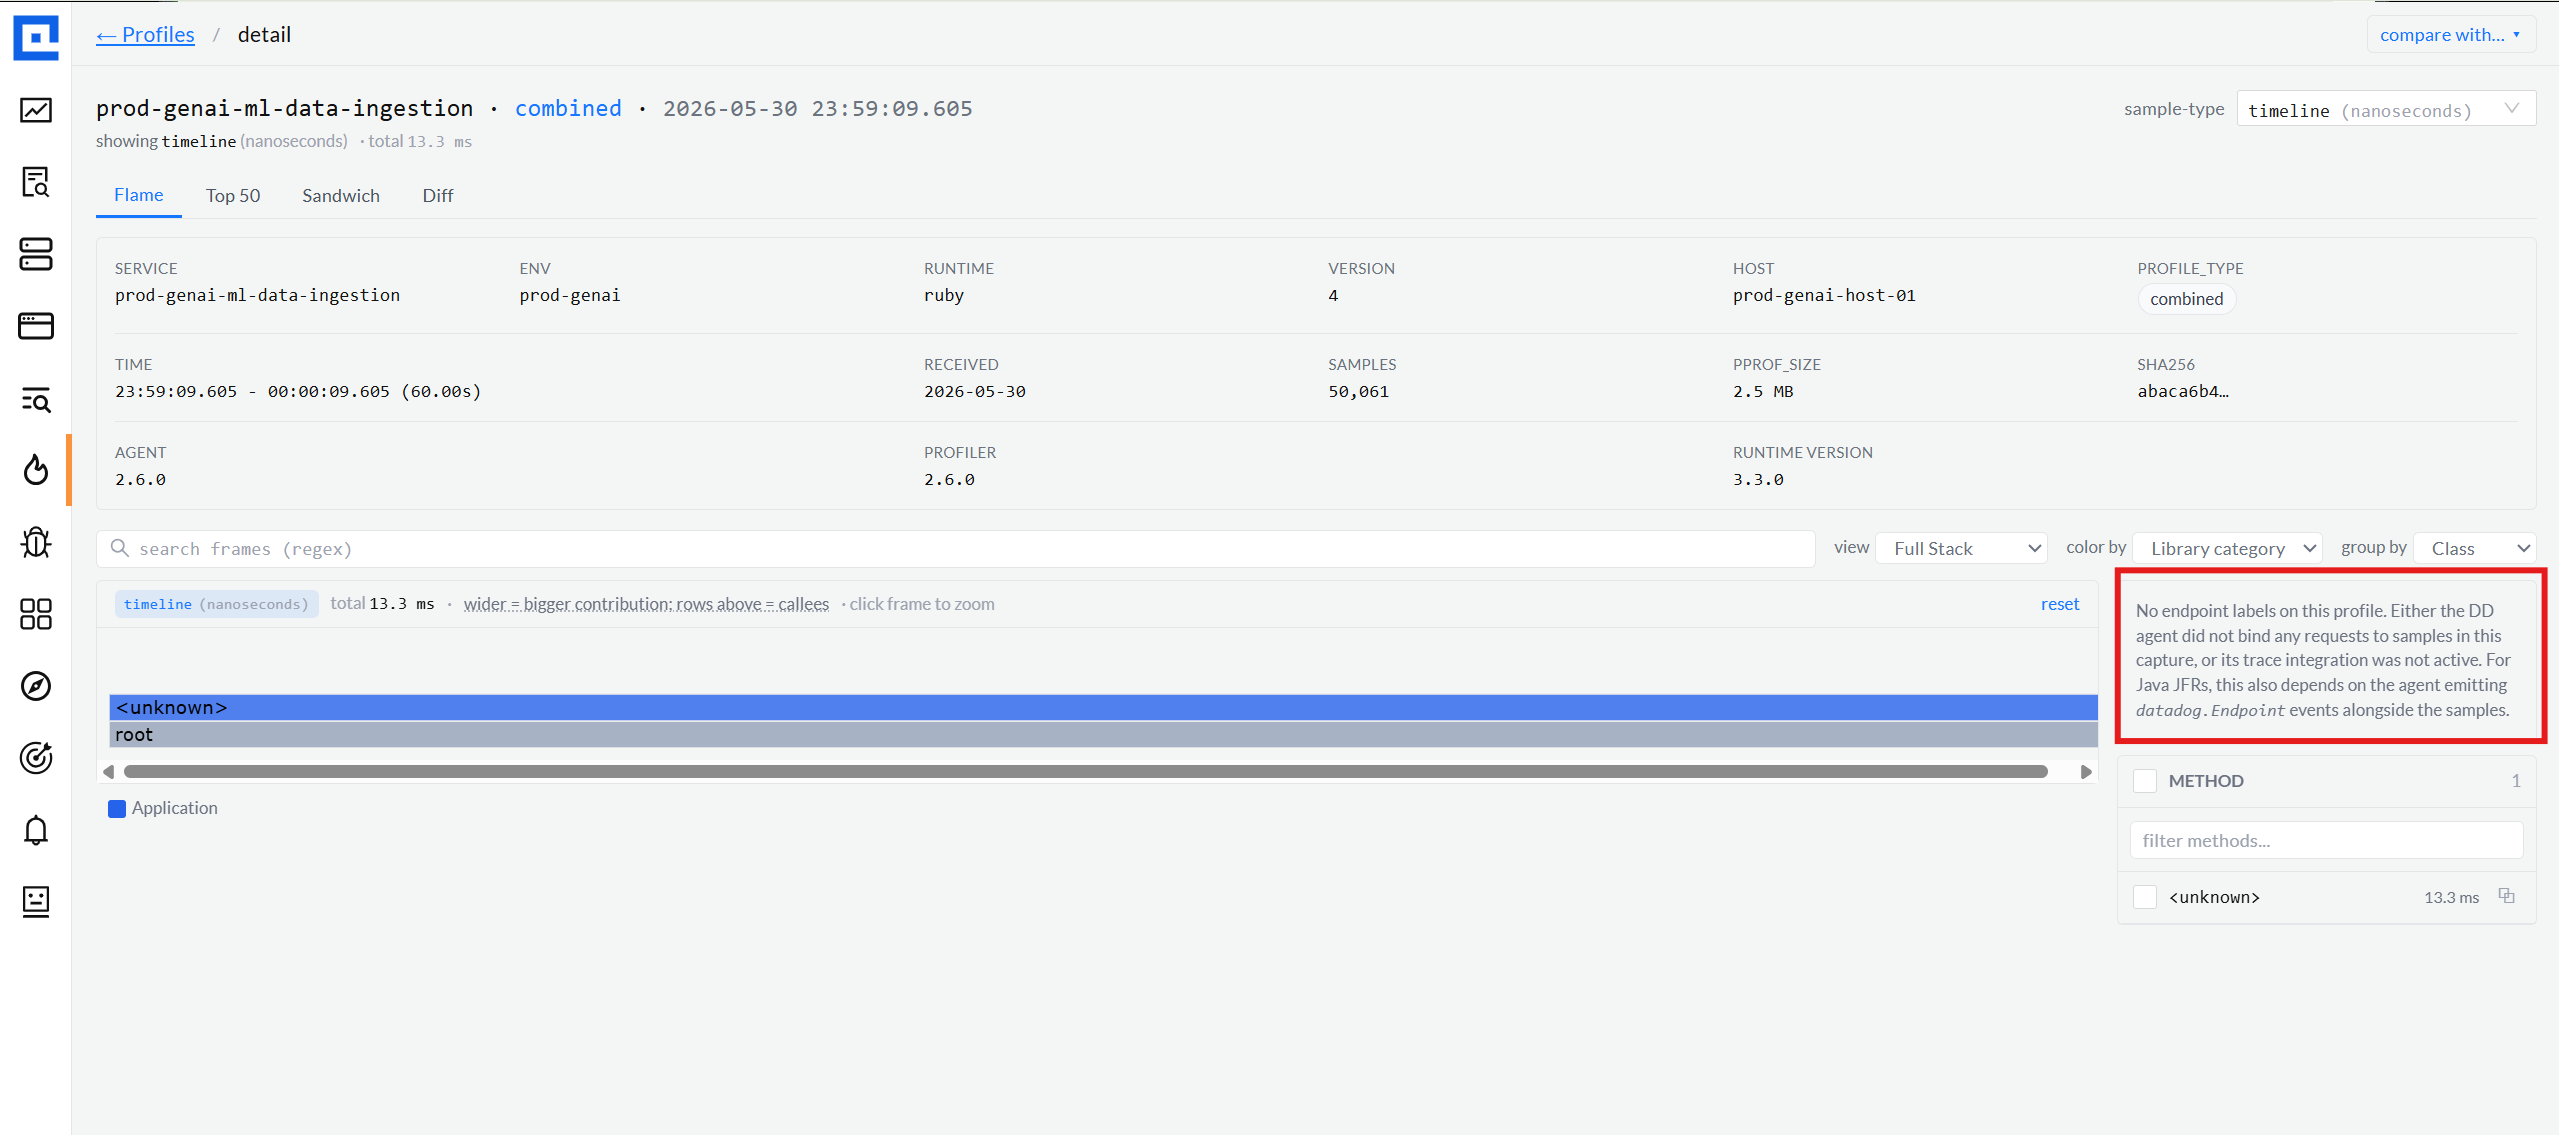
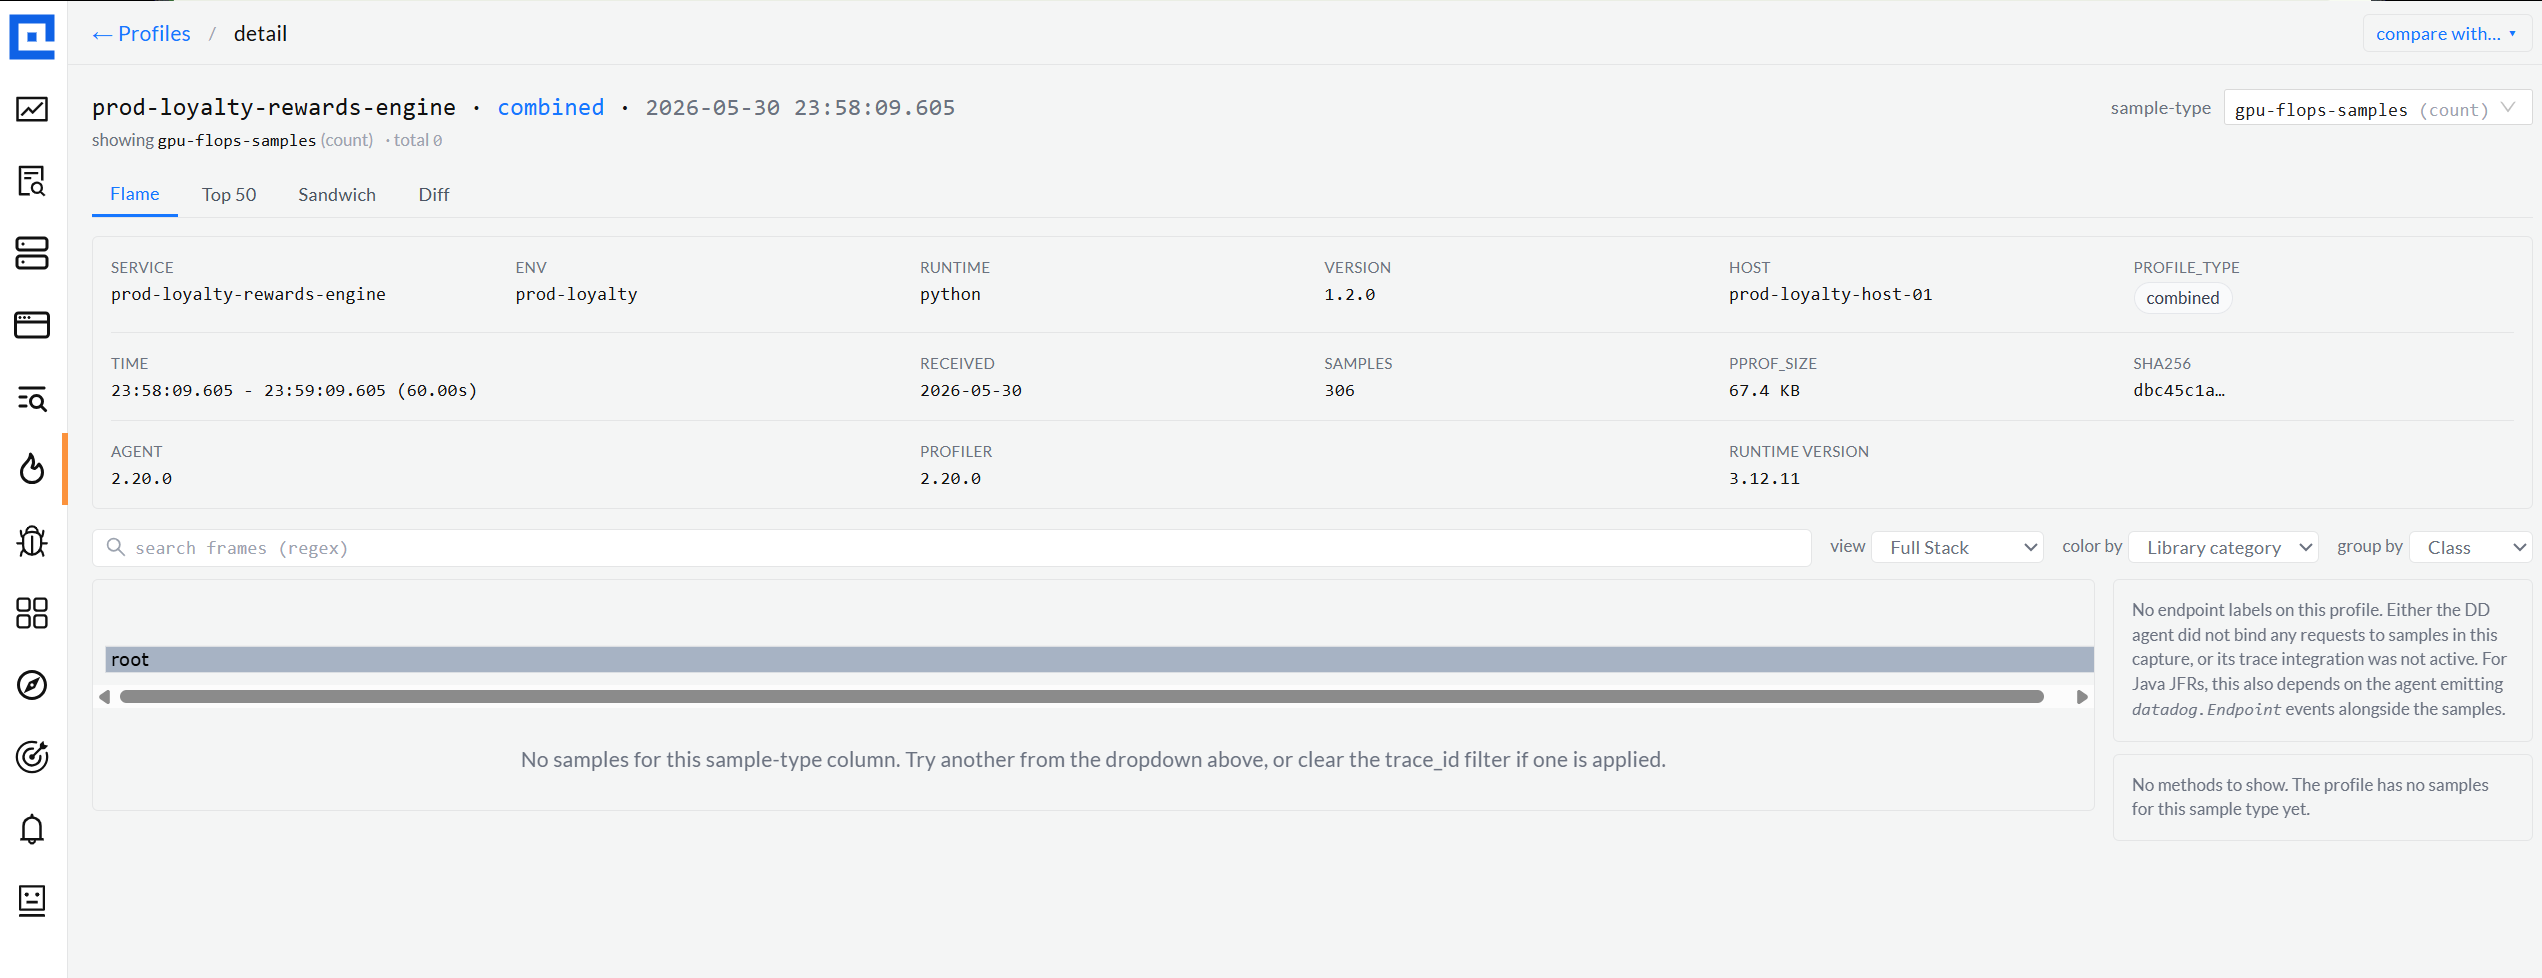
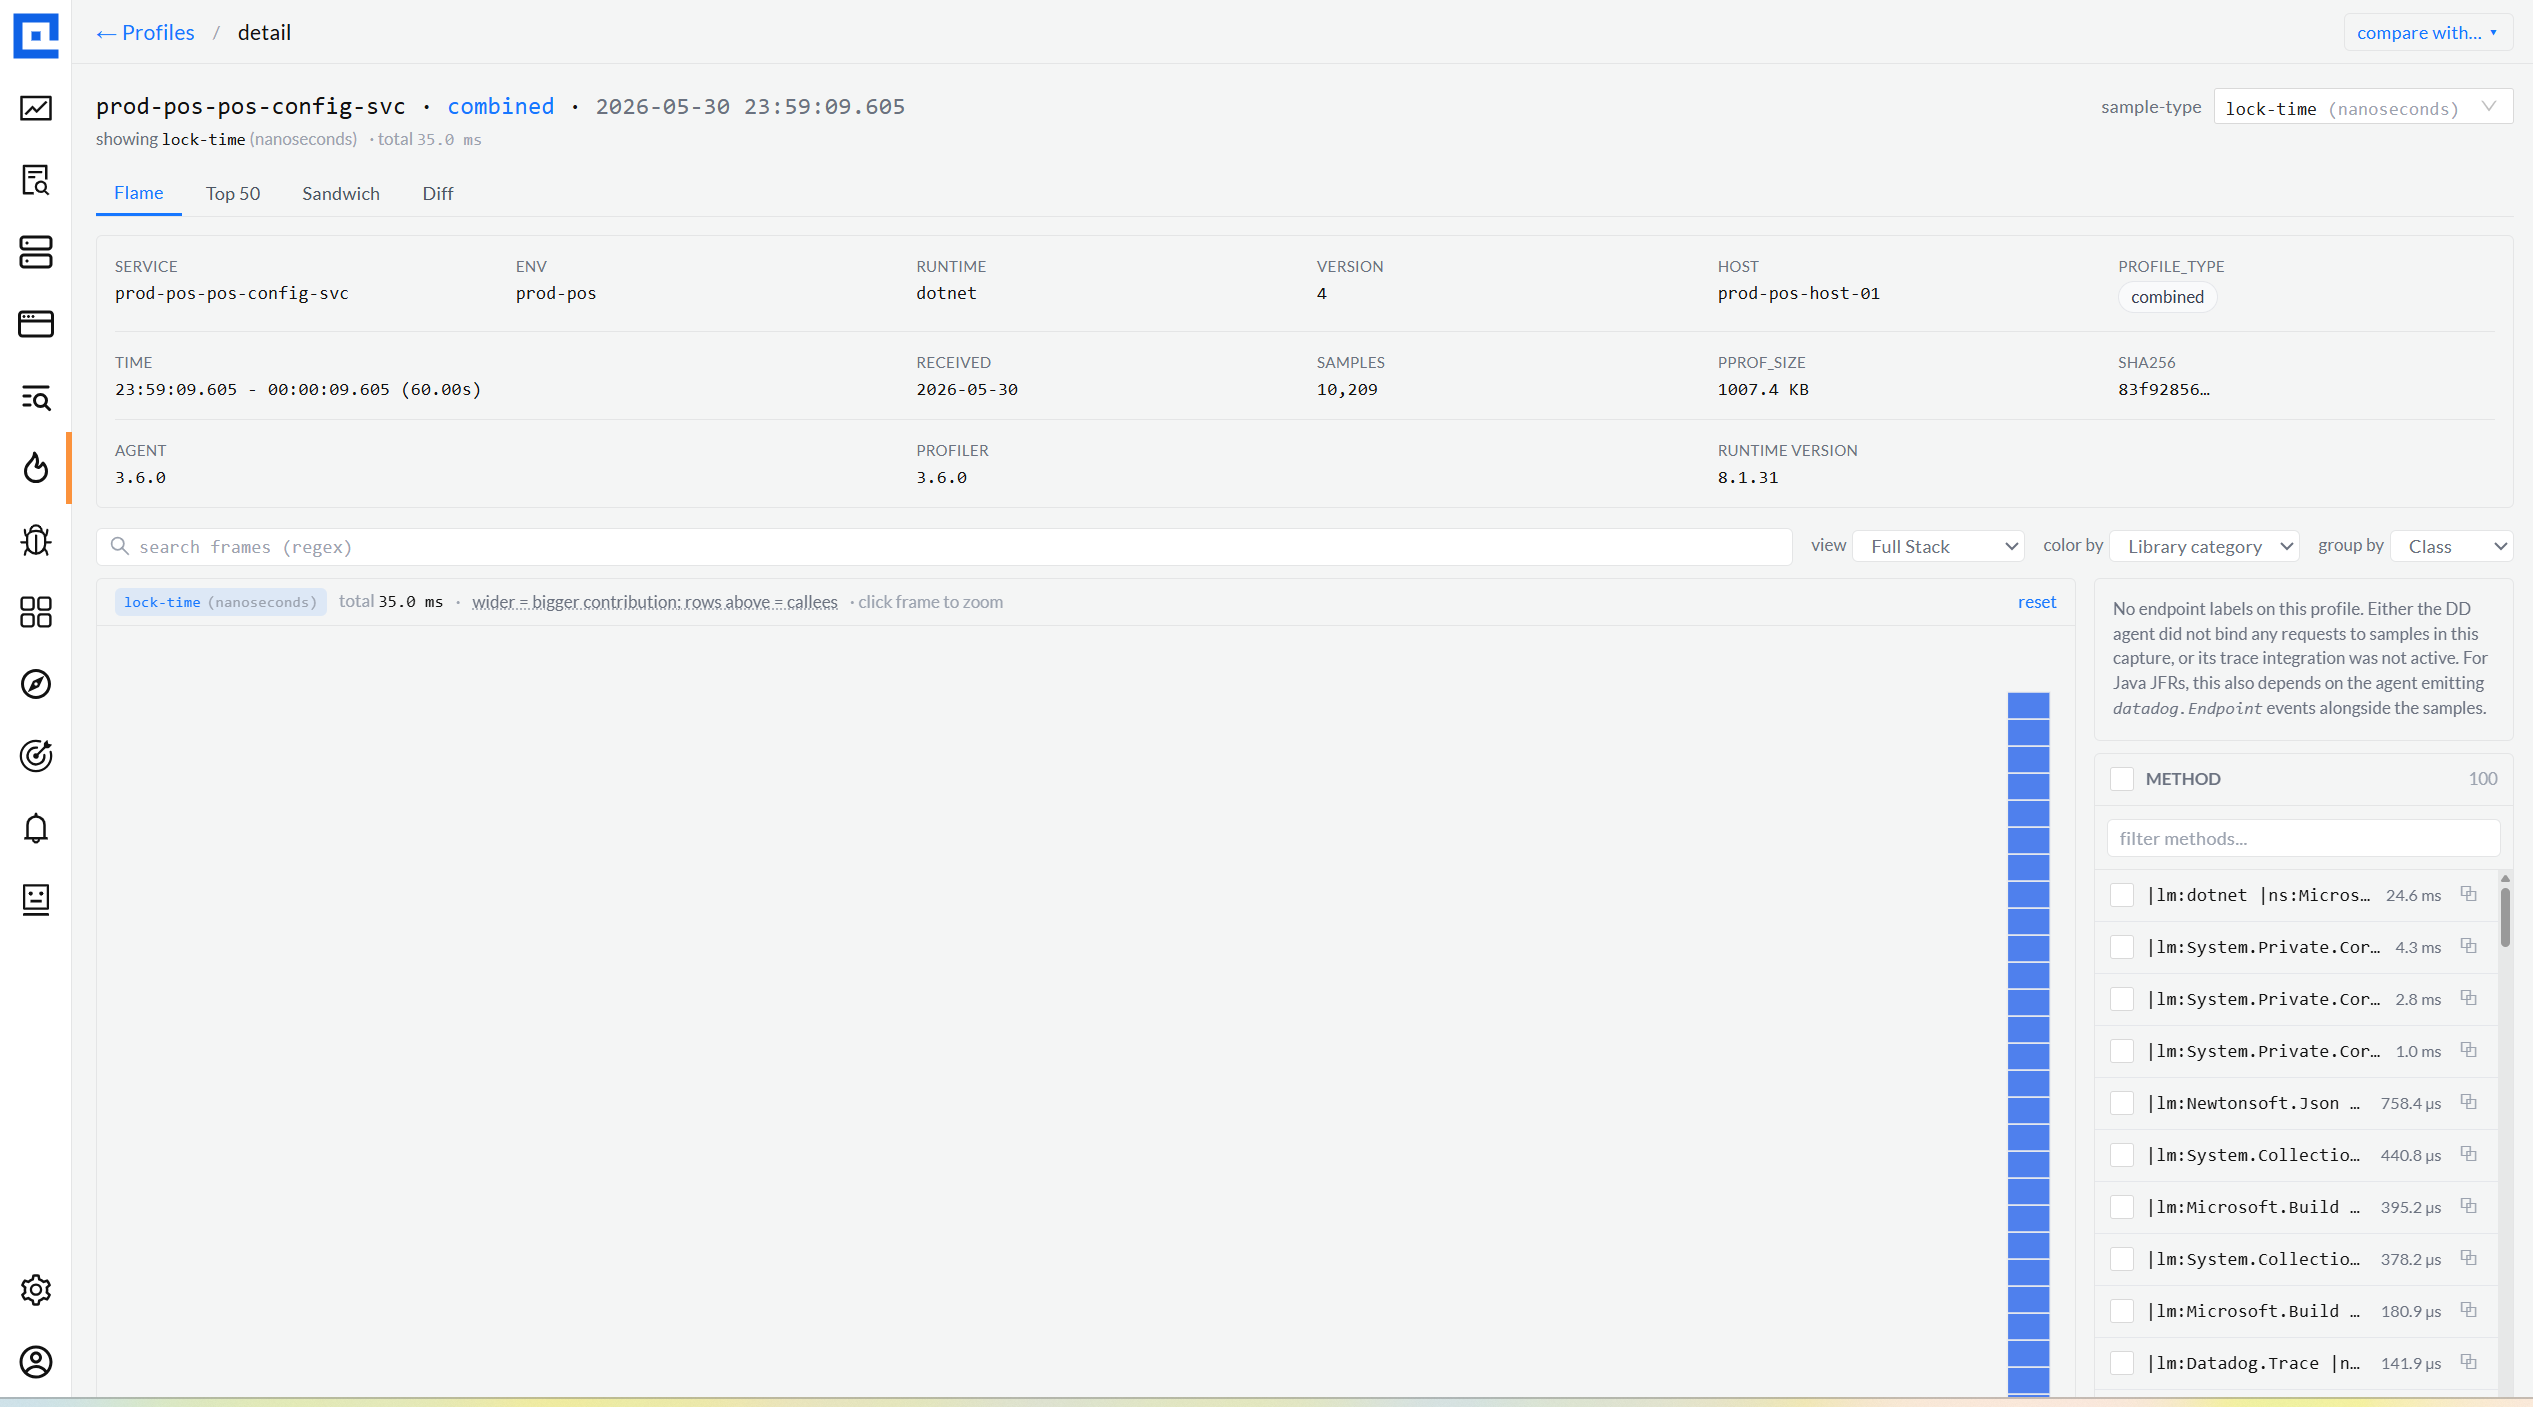
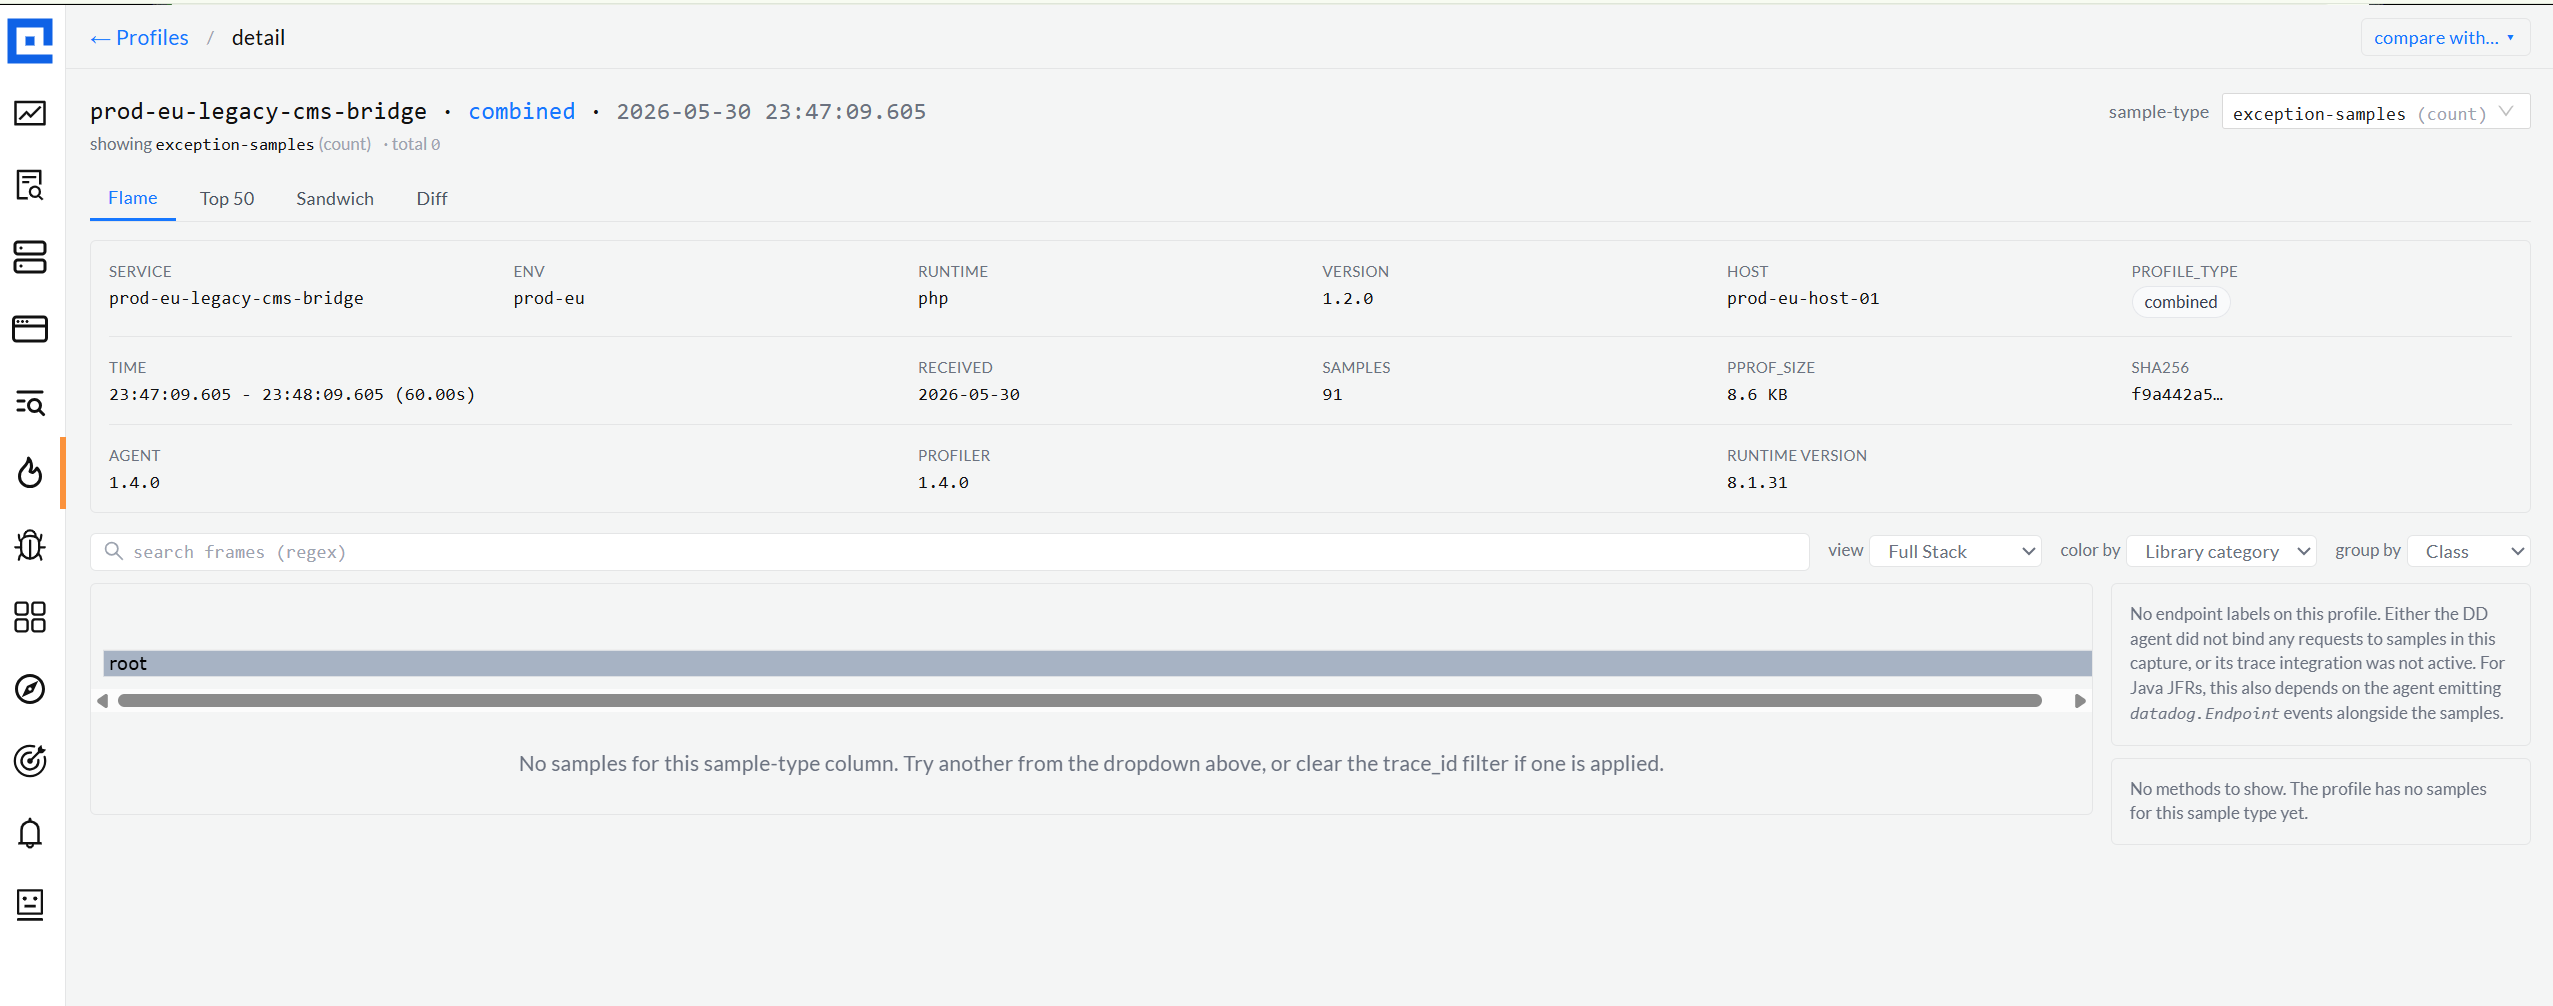
06 · Right rail
Endpoint breakdown + Method facet, both multi-select.
For Java services, the DataDog agent tags each CPU / wall / lock sample with the
endpoint it ran inside. The right rail tallies them with verb chip + path + share,
plus click-to-copy. When the agent didn't bind requests (old version, or tracing
off), an honest empty state explains why, no blank panel, no fake data.
Endpoints · 5 captured · click to filterpopulated
Empty state · honest, with reasonempty
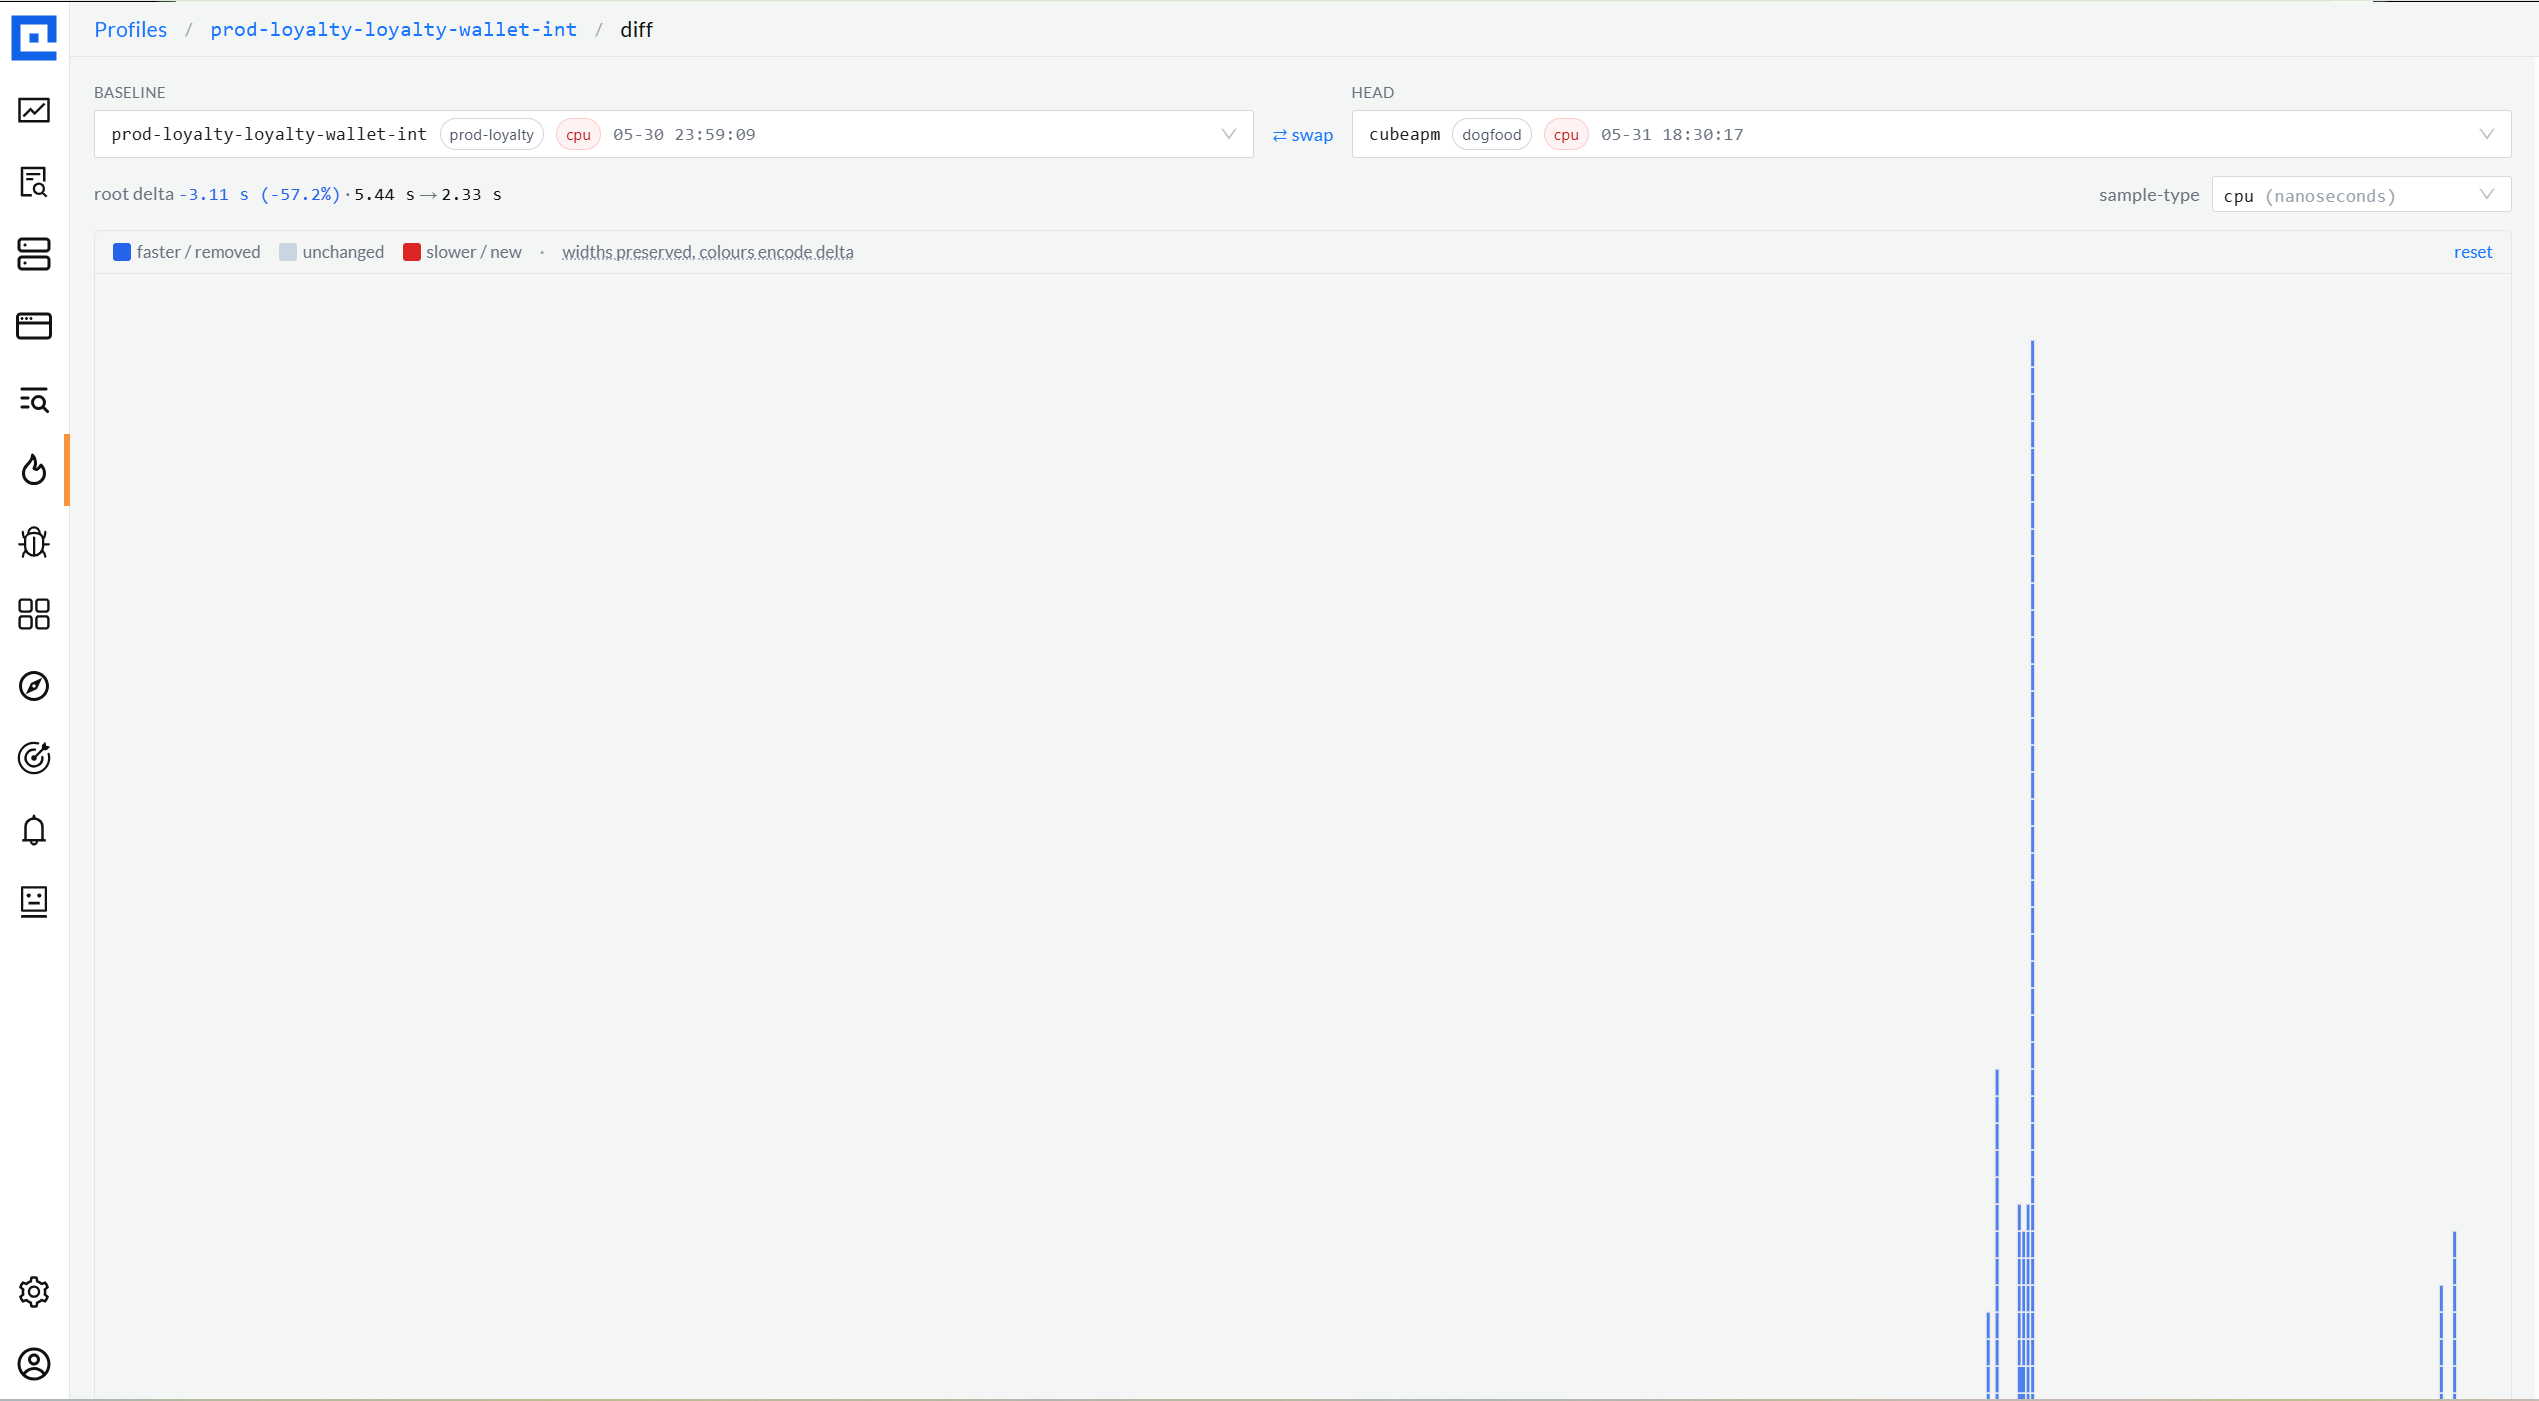
07 · Compare-To
Time-shift presets + cross-env auto-discovery.
From any profile, "Compare To" surfaces three time-shifts (1 hour ago, Yesterday,
Last week) plus auto-discovered cross-env candidates - when the same service exists in
prod-na
and prod-eu,
the dropdown lists "Same in prod-eu" as a one-click pivot. Largest-mover ordering
keeps the diff readable on a 4-frame-deep flame.
Compare With · time-shift presets + cross-env discovery
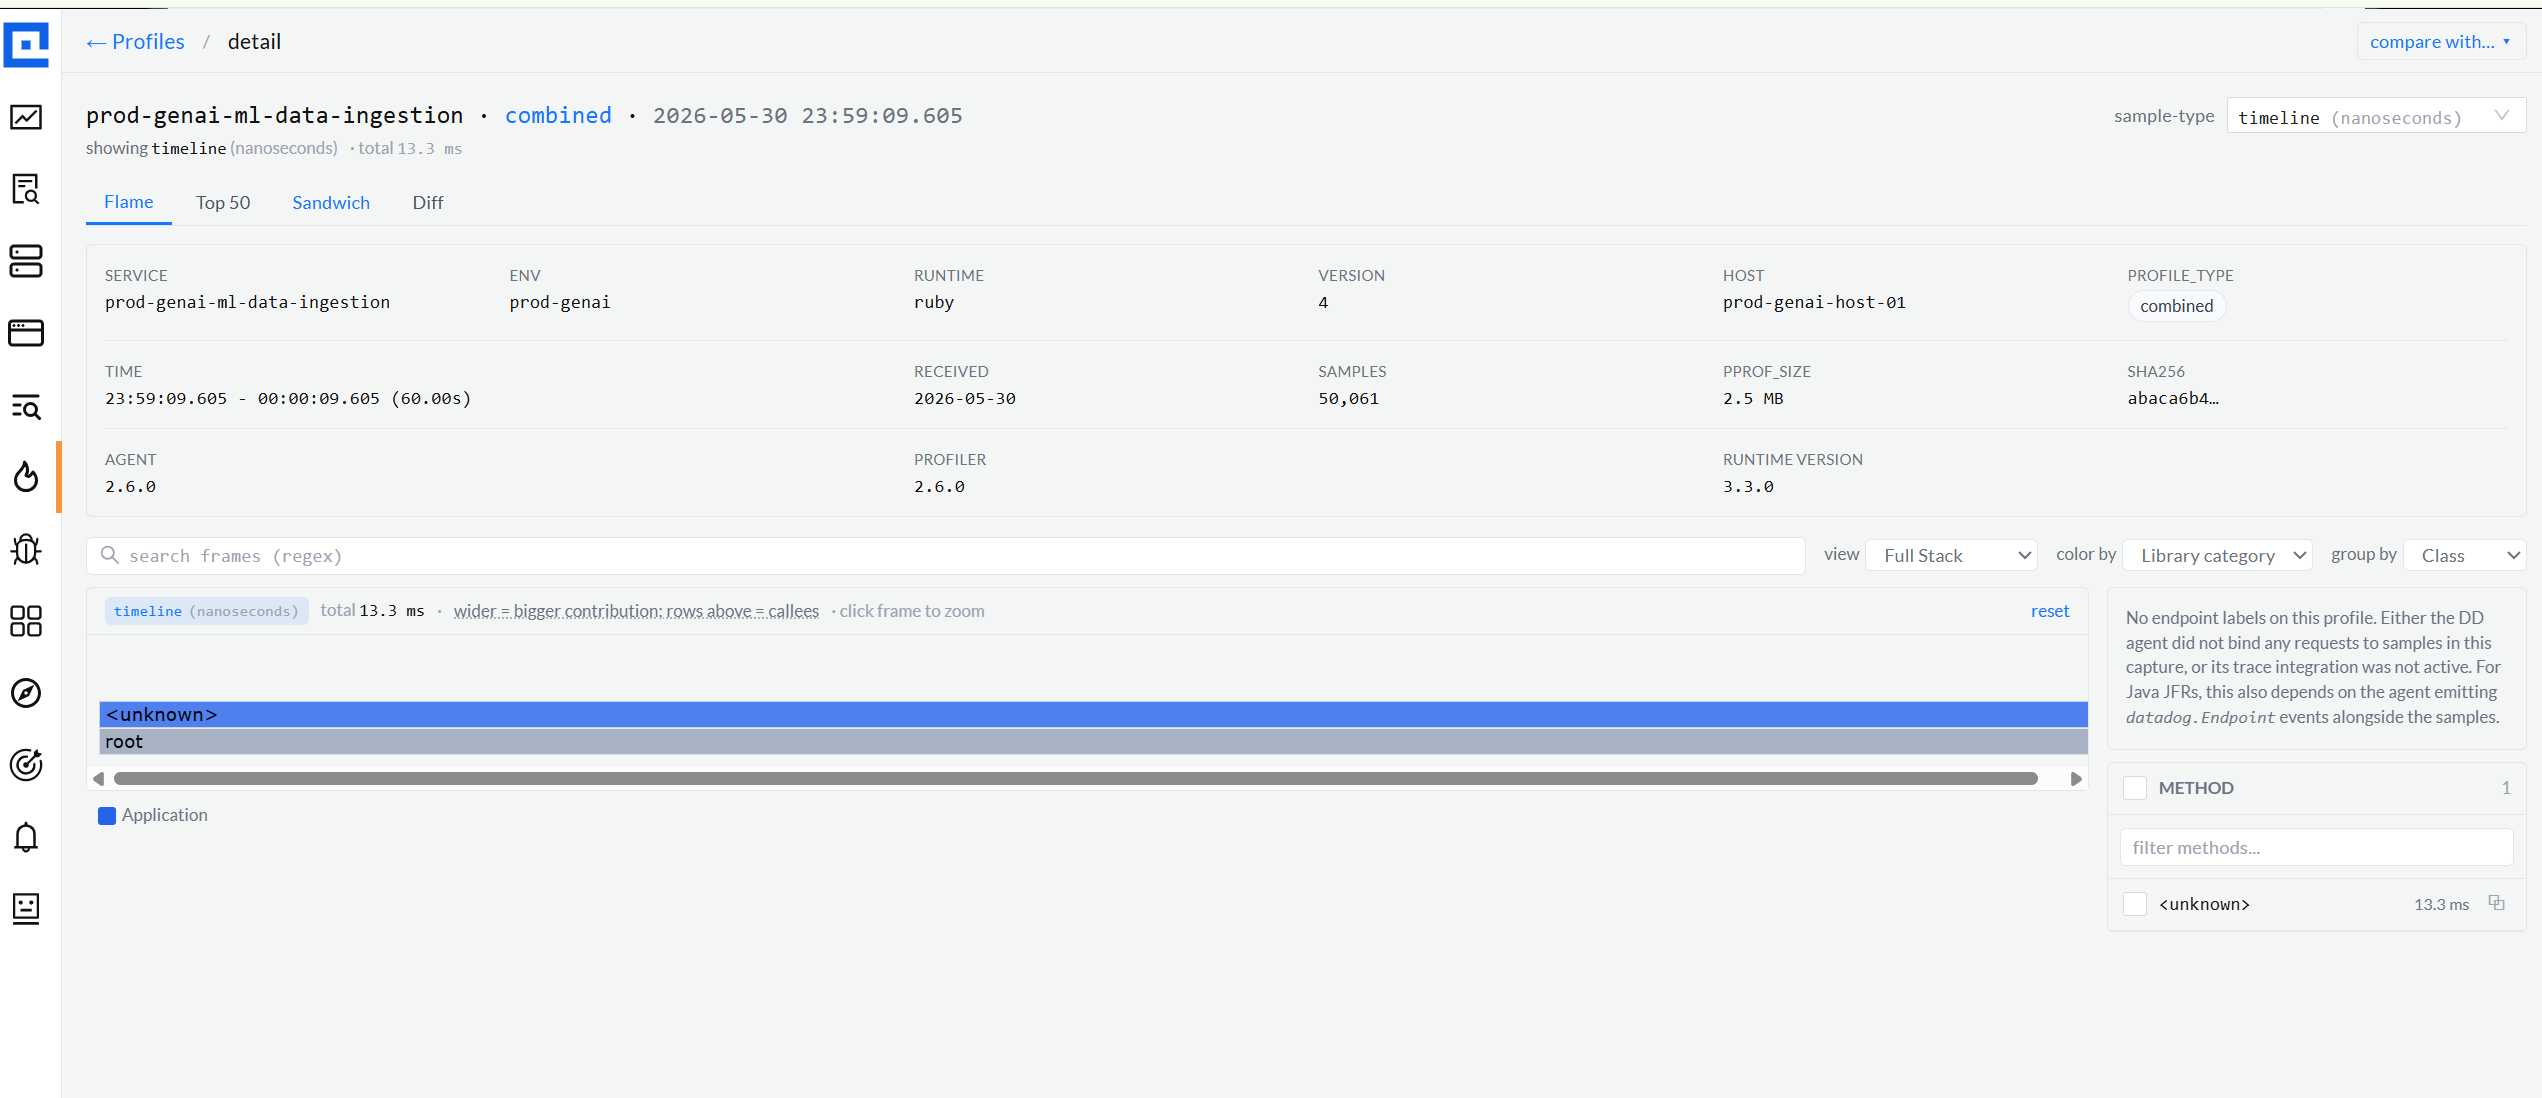
Runtimes
Every DataDog runtime, day one.
Phase 1 ingests every runtime DataDog supports. Java is the rich case - six profile records
per upload (cpu, alloc_space, lock_time, wall_time, gc_time, jfr-source). Others land
correctly with their native fan-out. Library categorization is keyed per-runtime so
"Only My Code" feels right whether the app is Spring or Go or Django.
Java · JFR fan-out into 6 recordsprimary
Go · 5 records (cpu / heap / block / mutex / goroutine)go
Python · combined CPU + heappython
Node · 3 records (cpu / heap / wall)node
.NET · pipe-format method decoding.net
Ruby · CPU + thread stateruby
PHP · CPUphp
Native · ddprof raw addresses (no symbolization in P1)native
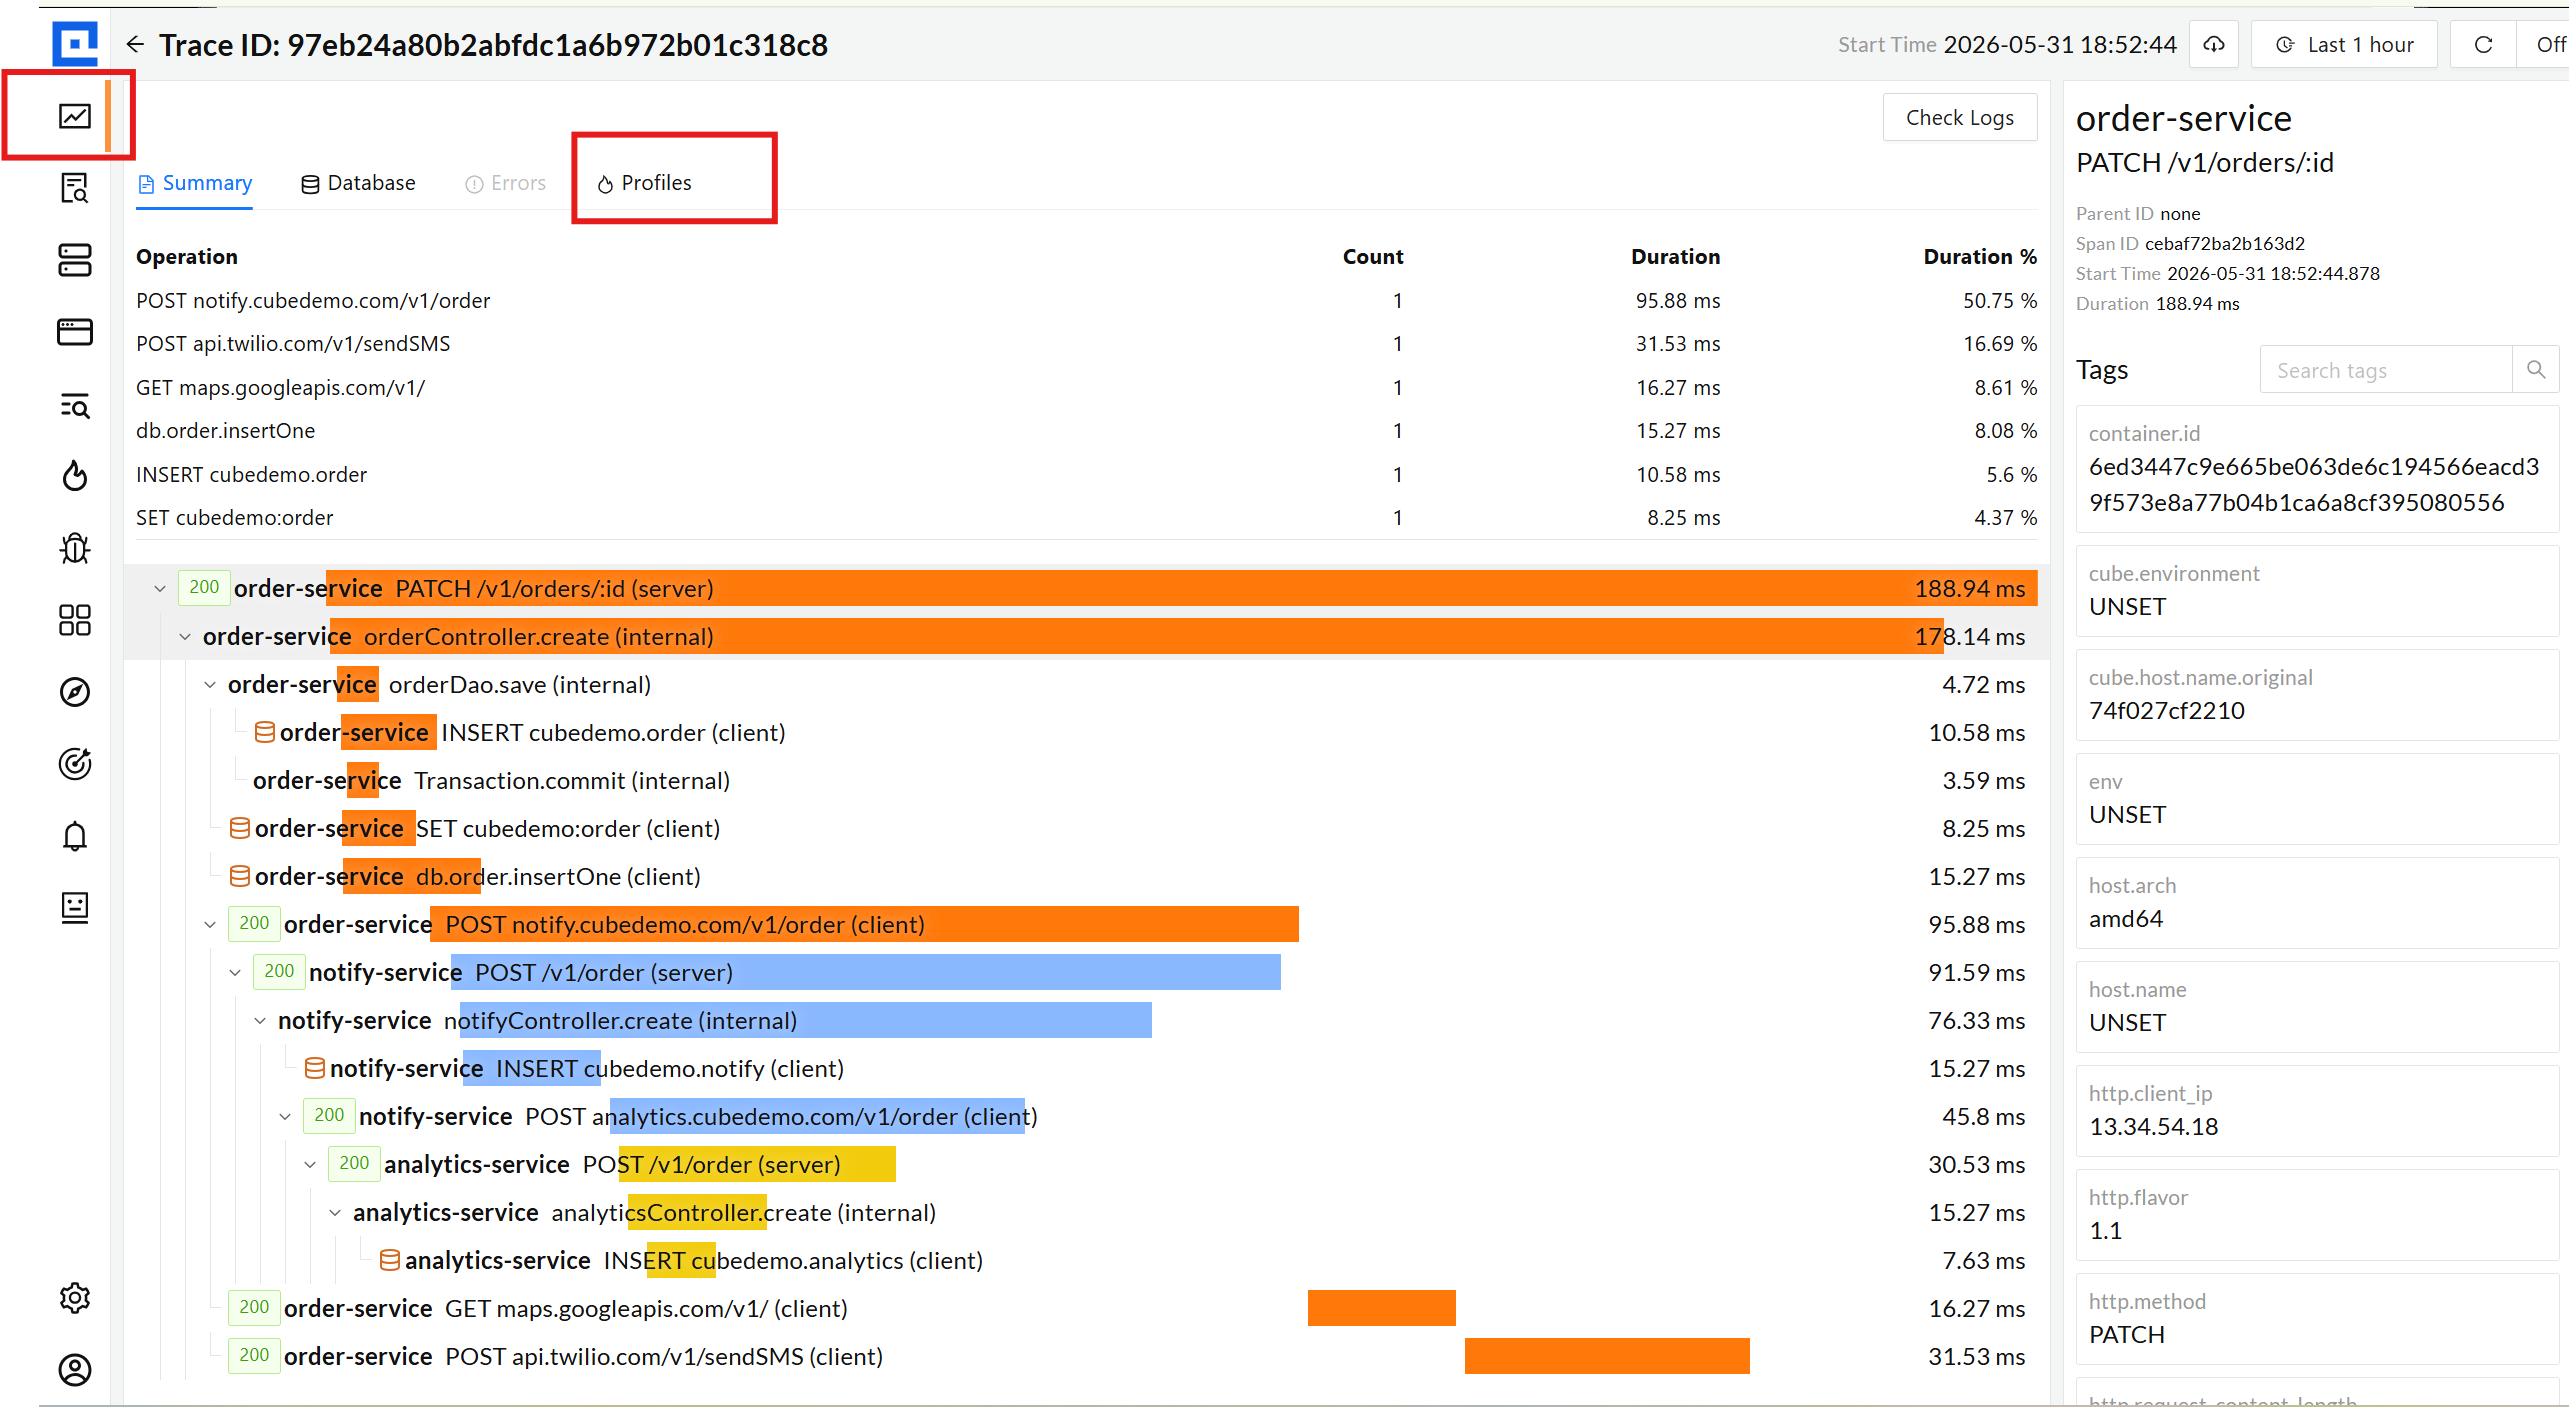
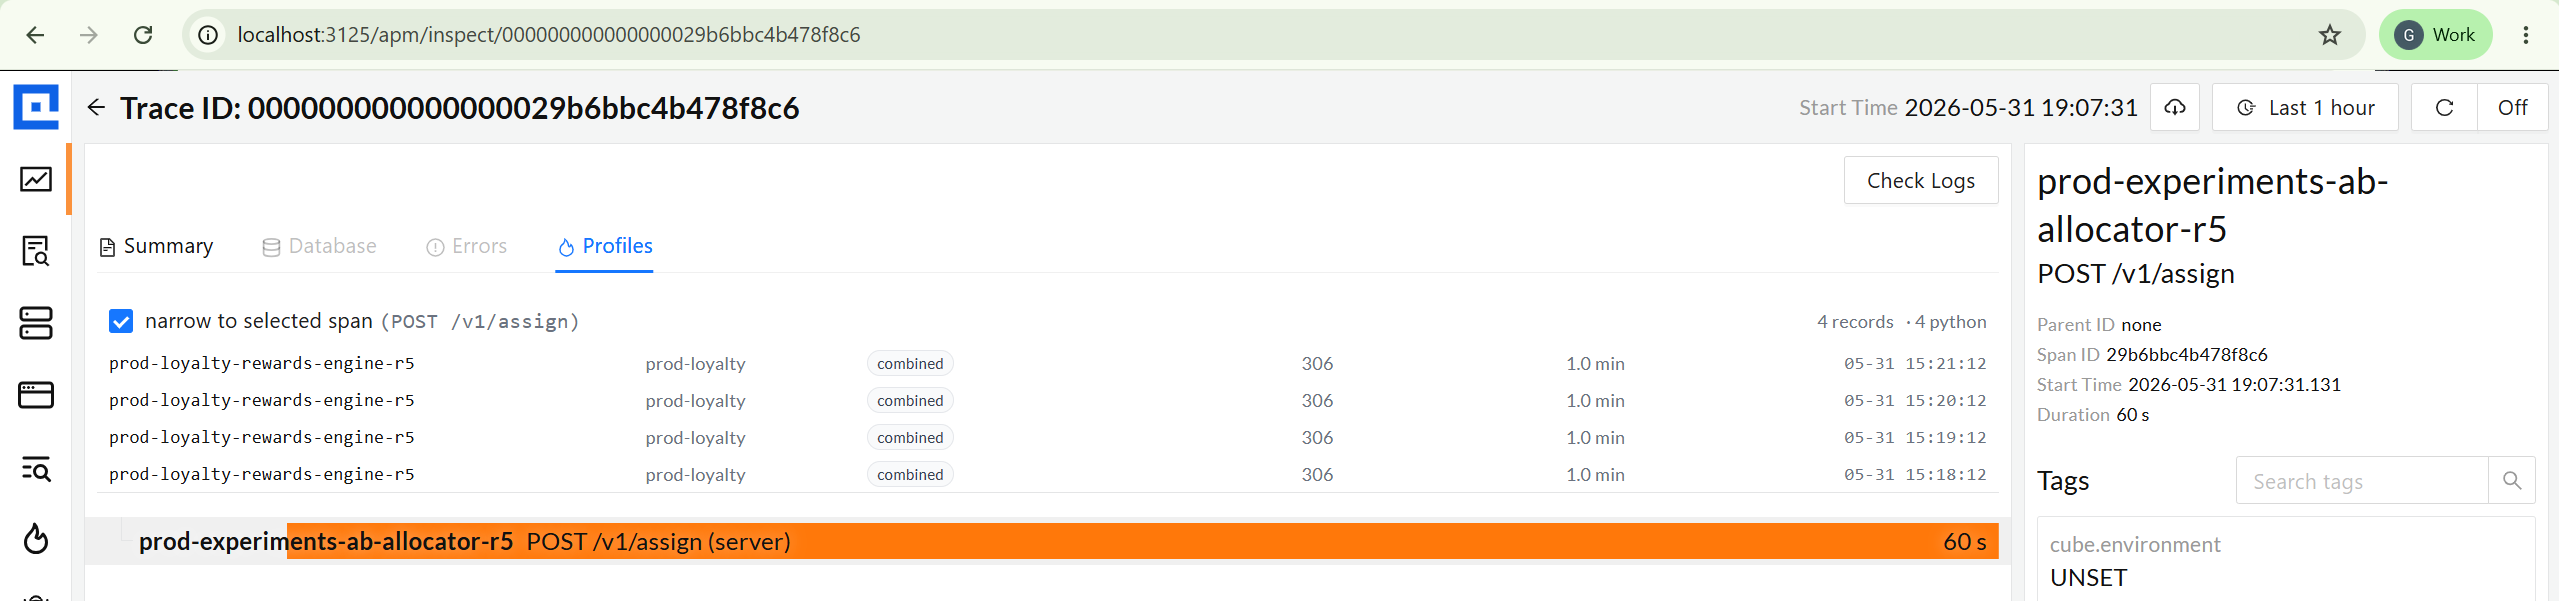
Trace pivot
From a slow trace → its profile, in one click.
Every Java / Python / Node / .NET / PHP upload carries the active trace ID on samples
that ran inside a span. The Trace Inspect view picks up the pivot and lists profile
records that overlap any span - or the whole trace. Tolerant of format drift between
signal sources (decimal vs hex trace IDs), so prod profiles correlate even when
encodings disagree.
Profiles tab on trace inspect - overlap window per span
Pivot finds 4 matching profile records for the selected trace
Engineering depth
Numbers that hold up under the preview flag.
Phase 1 is preview-flagged but not preview-quality. Test coverage matches the trace + log
receivers we ship today. Real-DataDog fixtures drive the parsers. The receiver gates ingest
behind a body-size cap, a decompression cap, and a configurable concurrency cap.